Woolworths Lentils 420g
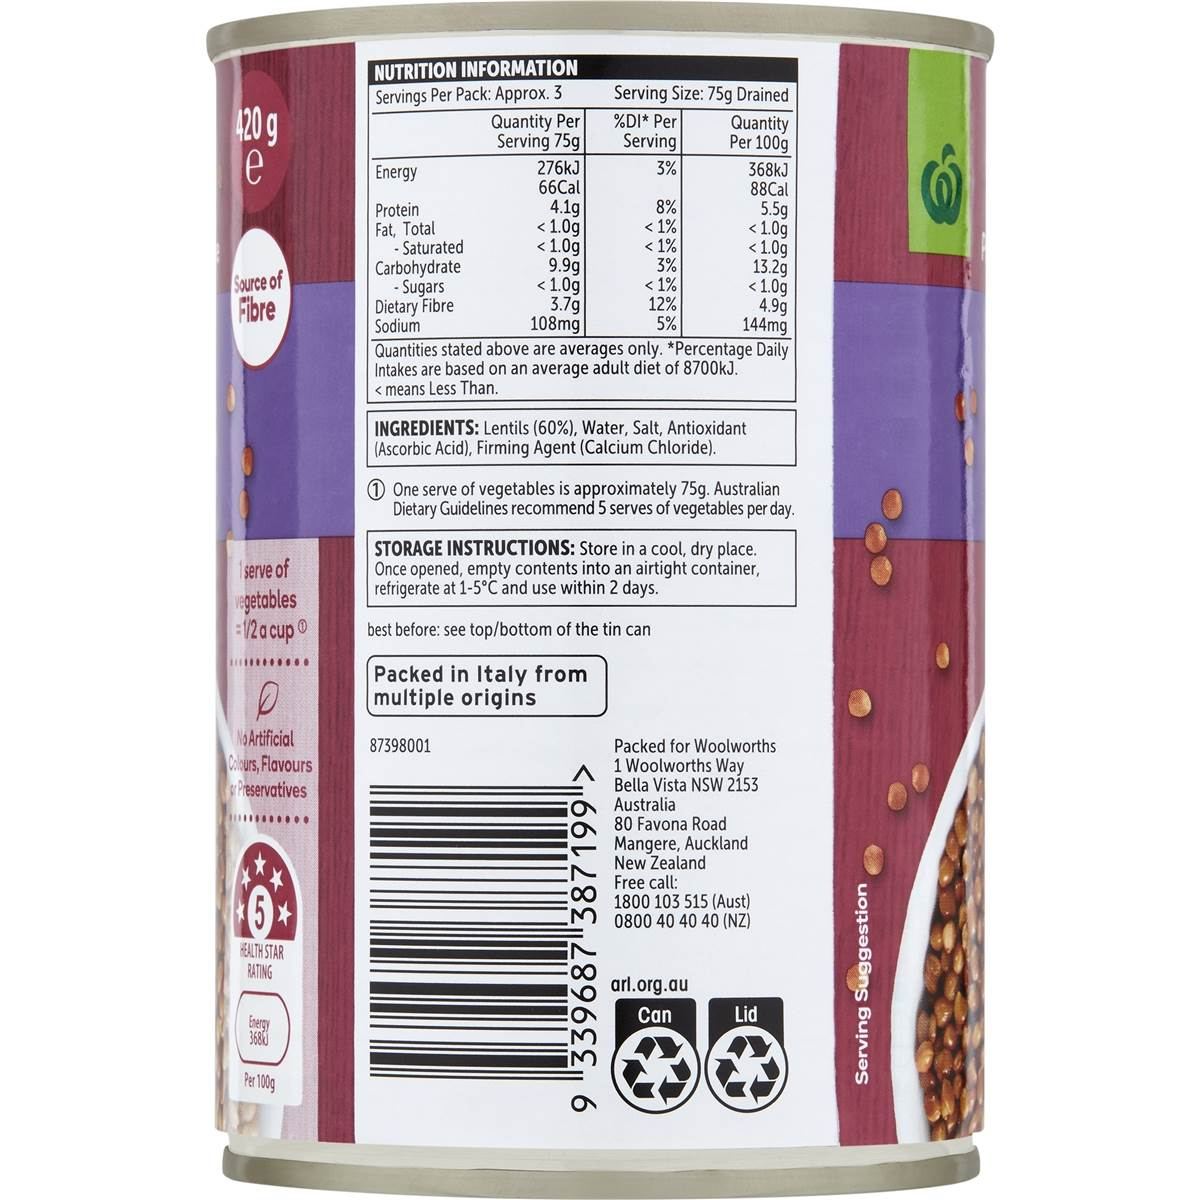
60% legume, 0 g sugars, no added sugar, 144 mg sodium per 100 g. Verified against the label photographed on pack.
Under review. The pack label disagrees with supplier data on: carb, kj, protein. We publish nothing for a value until the disagreement is resolved. See what changed.
Nutrition information per 100 g
Nutrition Information
| Energy | under review | under review | |
| Protein | under review | under review | |
| Fat, total | 0.5 g | #15 | ✓ 2 sources |
| - saturated | 0 g | #1 | ✓ 2 sources |
| Carbohydrate | under review | under review | |
| - sugars | 0 g | #1 | ✓ 2 sources |
| Dietary fibre | 4.9 g | #40 | ✓ 2 sources |
| Sodium | 144 mg | #15 | ✓ 2 sources |
✓ = independent sources agree and match the pack label. ◈ = printed on pack but absent from every data feed, read from the label photograph. Calories are converted from the labelled kilojoules (1 Cal = 4.184 kJ).
How it compares in canned beans
Lowest sugarsof 90
- 1Woolworths Four Bean Mix 420g0 g
- 1Woolworths Red Kidney Beans 420g0 g
- 1Woolworths Lentils 420g0 g
- 1Woolworths Black Beans 420g0 g
- 5Coles Simply Lentils0.01 g
Lowest sodiumof 87
- 1Edgell Beans Red Kidney No Added Salt7 mg
- 2Macro Organic Black Bean No Added Salt 420g8 mg
- 2Macro Organic Pinto Beans 420g8 mg
- 4Edgell No Added Salt Organic Chickpeas11 mg
- 5Macro Organic 3 Bean Mix 420g16 mg
- 15Woolworths Lentils 420g144 mg
Category leaders per 100 g, from the verified dataset. Open a list to see all products ranked, with this one highlighted.
 Open full size
Ingredients
Lentils (60%) Water Salt Antioxidant (Ascorbic acid) Firming Agent (Calcium Chloride)
60% legume by the pack’s own declaration
Where it ranks
Compared head-to-head
See all 100 canned beans products with verified nutrition, the canned beans rankings or every head-to-head comparison.