Woolworths Black Beans 420g
60% legume, 0 g sugars, no added sugar, 145 mg sodium per 100 g. Verified against the label photographed on pack.
Under review. The pack label disagrees with supplier data on: kj, protein. We publish nothing for a value until the disagreement is resolved. See what changed.
Nutrition information per 100 g
Nutrition Information
| Energy | under review | under review | |
| Protein | under review | under review | |
| Fat, total | 0.8 g | #54 | ✓ 2 sources |
| - saturated | 0 g | #1 | ✓ 2 sources |
| Carbohydrate | 14 g | #44 | ✓ 2 sources |
| - sugars | 0 g | #1 | ✓ 2 sources |
| Dietary fibre | 6.6 g | #16 | ✓ 2 sources |
| Sodium | 145 mg | #16 | ✓ 2 sources |
✓ = independent sources agree and match the pack label. ◈ = printed on pack but absent from every data feed, read from the label photograph. Calories are converted from the labelled kilojoules (1 Cal = 4.184 kJ).
How it compares in canned beans
Lowest sugarsof 90
- 1Woolworths Four Bean Mix 420g0 g
- 1Woolworths Red Kidney Beans 420g0 g
- 1Woolworths Lentils 420g0 g
- 1Woolworths Black Beans 420g0 g
- 5Coles Simply Lentils0.01 g
Lowest sodiumof 87
- 1Edgell Beans Red Kidney No Added Salt7 mg
- 2Macro Organic Black Bean No Added Salt 420g8 mg
- 2Macro Organic Pinto Beans 420g8 mg
- 4Edgell No Added Salt Organic Chickpeas11 mg
- 5Macro Organic 3 Bean Mix 420g16 mg
- 16Woolworths Black Beans 420g145 mg
Category leaders per 100 g, from the verified dataset. Open a list to see all products ranked, with this one highlighted.
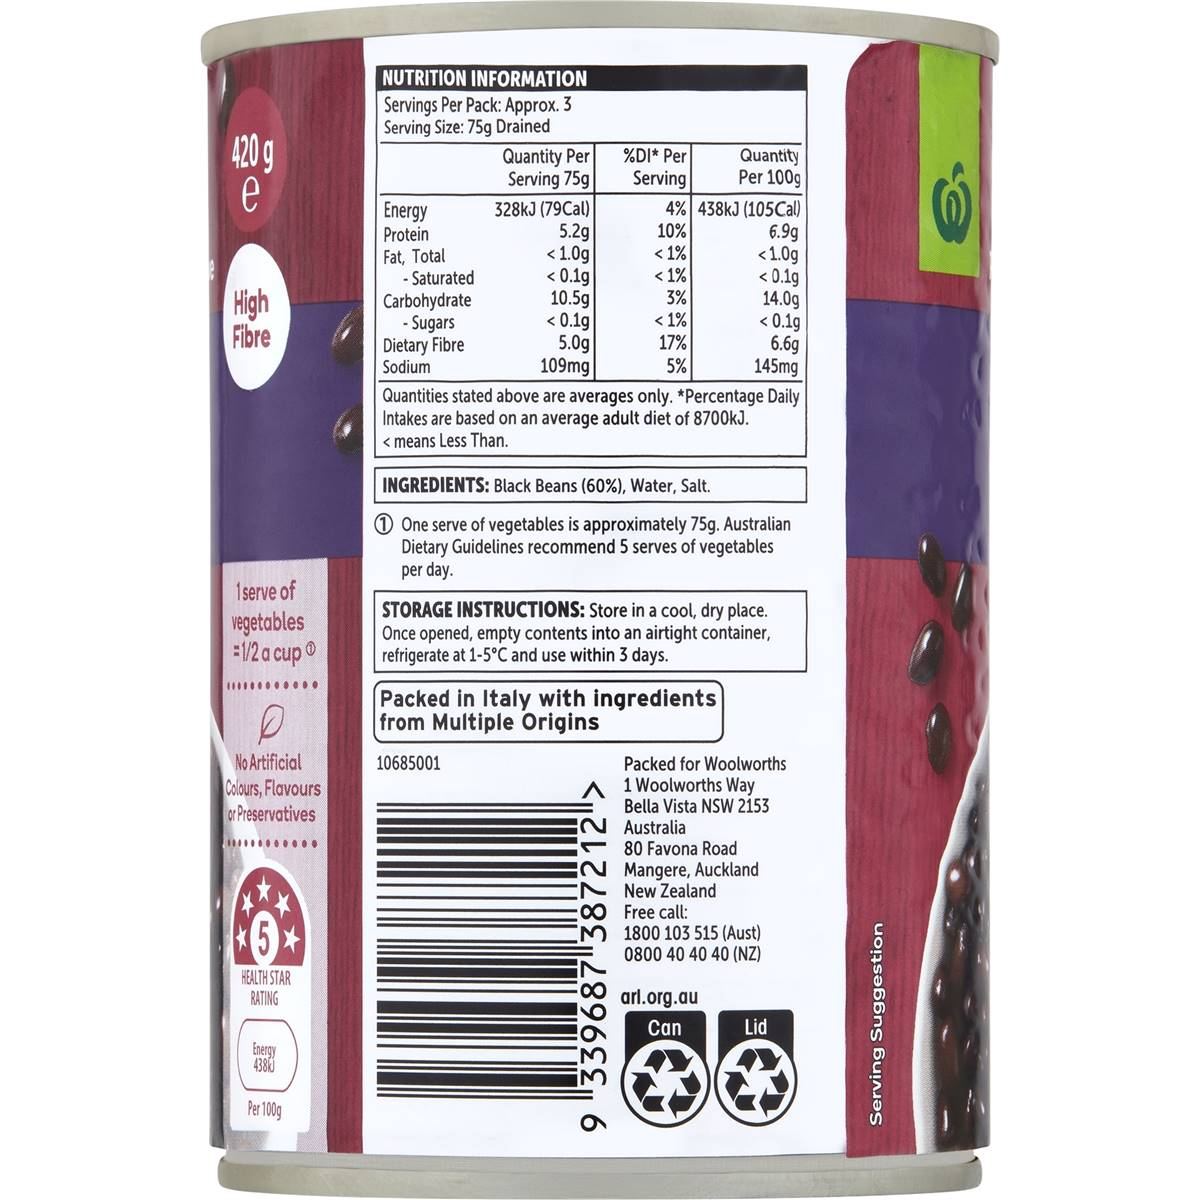 Open full size
Ingredients
Black Beans (60%), Water, Salt
60% legume by the pack’s own declaration
Where it ranks
Compared head-to-head
vs Edgell Black Beans Plant Protein 400g vs Macro Organic Red Kidney Beans 425g vs Edgell Red Kidney Beans Fibre Rich 400g
See all 100 canned beans products with verified nutrition, the canned beans rankings or every head-to-head comparison.