Belvita Milk & Cereals Breakfast Biscuits 300g 6 pack
8% wholegrain, 1880 kJ (449 Cal), 20.1 g sugars, 90 mg sodium per 100 g. Verified against the label photographed on pack.
Under review. The pack label disagrees with supplier data on: kj, sodium. Those rows are marked * below and show what each source reports; none is published as verified, or used in rankings and comparisons, until the disagreement is resolved. See what changed.
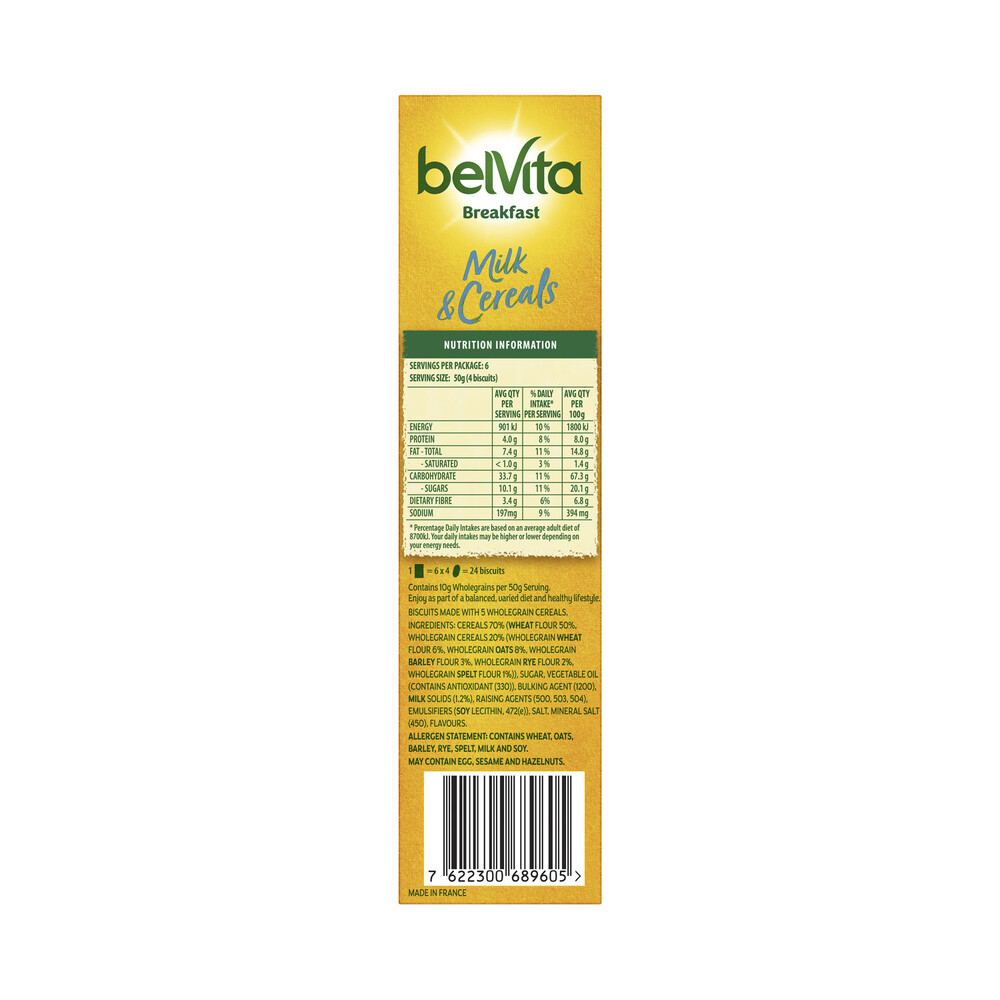
Nutrition information per 100 g
Nutrition Information
| Energy | 1880 kJ (449 Cal) | #60 | ✓ 2 sources |
| Protein | 8 g | #24 | ✓ 3 sources |
| Fat, total | 14.8 g | #61 | ✓ 3 sources |
| - saturated | 1.4 g | #10 | ✓ 3 sources |
| - monounsaturated | 0 g | ✓ 2 sources | |
| - polyunsaturated | 0 g | ✓ 2 sources | |
| - trans | 0 g | ✓ 2 sources | |
| Carbohydrate | 67.3 g | #192 | ✓ 3 sources |
| - sugars | 20.1 g | #31 | ✓ 3 sources |
| Dietary fibre | 6.8 g | #9 | ✓ 3 sources |
| Sodium | 90 mg | #22 | ✓ 2 sources |
✓ = independent sources agree and match the pack label. ◈ = printed on pack but absent from every data feed, read from the label photograph. Calories are converted from the labelled kilojoules (1 Cal = 4.184 kJ).
How it compares in biscuits
Lowest energyof 328
- 1Coles Bakery Christmas Red Velvet Cookie356 Cal
- 2Jon-Jon Ginger Kisses Cream Filled Sponge Cake 8 Pack368 Cal
- 3BELMONT BISCUIT CO. Jaffa Cakes 150g375 Cal
- 4McVitie's Jaffa Cakes 10 Pack 106g380 Cal
- 5Dolce Verona Savoiardi Lady Fingers Biscuits 400g382 Cal
- 60Belvita Milk & Cereals Breakfast Biscuits 300g 6 pack449 Cal
Highest proteinof 324
- 1Bake Strong Co. Choc Chip Protein Cookie21.5 g
- 2Bake Strong Co Choc Caramel Crisp Protein Cookie21 g
- 3BELMONT BISCUIT CO. Peanut Cookies 175g12.3 g
- 4Rutherford & Meyer Gourmet Cheese Wafers Garlic & Olive Oil12.2 g
- 5OB Finest Biscotti Biscuits Pistachio & Cranberry 100g11.9 g
- 24Belvita Milk & Cereals Breakfast Biscuits 300g 6 pack8 g
Lowest sugarsof 325
- 1Rutherford & Meyer Gourmet Cheese Wafers Natural0.5 g
- 1BELMONT BISCUIT CO. Sugar Free Maria Biscuits 200g0.5 g
- 3Rutherford & Meyer Gourmet Cheese Wafers Garlic & Olive Oil1.1 g
- 4Fantastic Delites Rice Snacks Sweet Chilli & Sour Cream4.8 g
- 5Fantastic Delites Rice Snacks Sour Cream & Chive6.6 g
- 31Belvita Milk & Cereals Breakfast Biscuits 300g 6 pack20.1 g
Lowest sodiumof 323
- 1BELMONT BISCUIT CO. Dark Chocolate Coated Rice Cakes 150g5 mg
- 2Kez's Kitchen Fudgy Chocolate Flourless Brownies 210g18 mg
- 3BELMONT BISCUIT CO. Milk Chocolate Coated Rice Cakes 150g30 mg
- 4Coles Movember Biscuit37 mg
- 5BELMONT BISCUIT CO. Yogurt Coated Rice Cakes 150g38 mg
- 22Belvita Milk & Cereals Breakfast Biscuits 300g 6 pack90 mg
Category leaders per 100 g, from the verified dataset. Open a list to see all products ranked, with this one highlighted.
 Open full size
Ingredients
Cereals 71% (Wheat Flour 50%, Wholegrain Cereals 21% (Wholegrain Wheat Flour 7%, Wholegrain Oats 8%, Wholegrain Barley Flour 3%, Wholegrain Rye Flour 2%, Wholegrain Spelt (Wheat) Flour 1%)), Sugar, Vegetable Oil (Contains Antioxidant (330)), Polydextrose, Milk Solids (1.1%), Raising Agents (500, 503, 504), Emulsifiers (Soy Lecithin, 472(e)), Flavours, Salt.
8% wholegrain by the pack’s own declaration
Where it ranks
#9 of 169 · Highest fibre #10 of 327 · Lowest saturated fat #24 of 324 · Highest protein #31 of 325 · Lowest sugar #60 of 328 · Lowest kilojoules
Compared head-to-head
vs Coles Bakery Mixed Biscuit Tray vs McVitie's Hobnobs Original Oat Snap 255g vs Arnott's Marie Biscuits 250g
See all 355 biscuits products with verified nutrition, the biscuits rankings or every head-to-head comparison.