Woolworths Garden Peas Green 420g
63% vegetables, no added sugar per 100 g. Verified against the label photographed on pack.
Under review. The pack label disagrees with supplier data on: carb, fibre, kj, sodium, sugar. We publish nothing for a value until the disagreement is resolved. See what changed.
Nutrition information per 100 g
Nutrition Information
| Energy | under review | under review | |
| Protein | 5.3 g | #5 | ✓ 2 sources |
| Fat, total | 0.7 g | #72 | ✓ 2 sources |
| - saturated | 0.1 g | #22 | ✓ 2 sources |
| - monounsaturated | 0.1 g | reported | |
| - polyunsaturated | 0.3 g | reported | |
| - trans | 0.01 g | reported | |
| Carbohydrate | under review | under review | |
| - sugars | under review | under review | |
| Dietary fibre | under review | under review | |
| Sodium | under review | under review | |
| Potassium | 120 mg | reported |
✓ = independent sources agree and match the pack label. ◈ = printed on pack but absent from every data feed, read from the label photograph. Calories are converted from the labelled kilojoules (1 Cal = 4.184 kJ).
How it compares in canned veg
Highest proteinof 116
- 1Farrows Giant Marrowfat Peas 300g6.7 g
- 2Batchelors Mushy Peas Canned Original 300g5.9 g
- 2Batchelors Mushy Peas Canned Chip Shop 300g5.9 g
- 4Coles Baby Peas5.8 g
- 5Woolworths Garden Peas Green 420g5.3 g
Category leaders per 100 g, from the verified dataset. Open a list to see all products ranked, with this one highlighted.
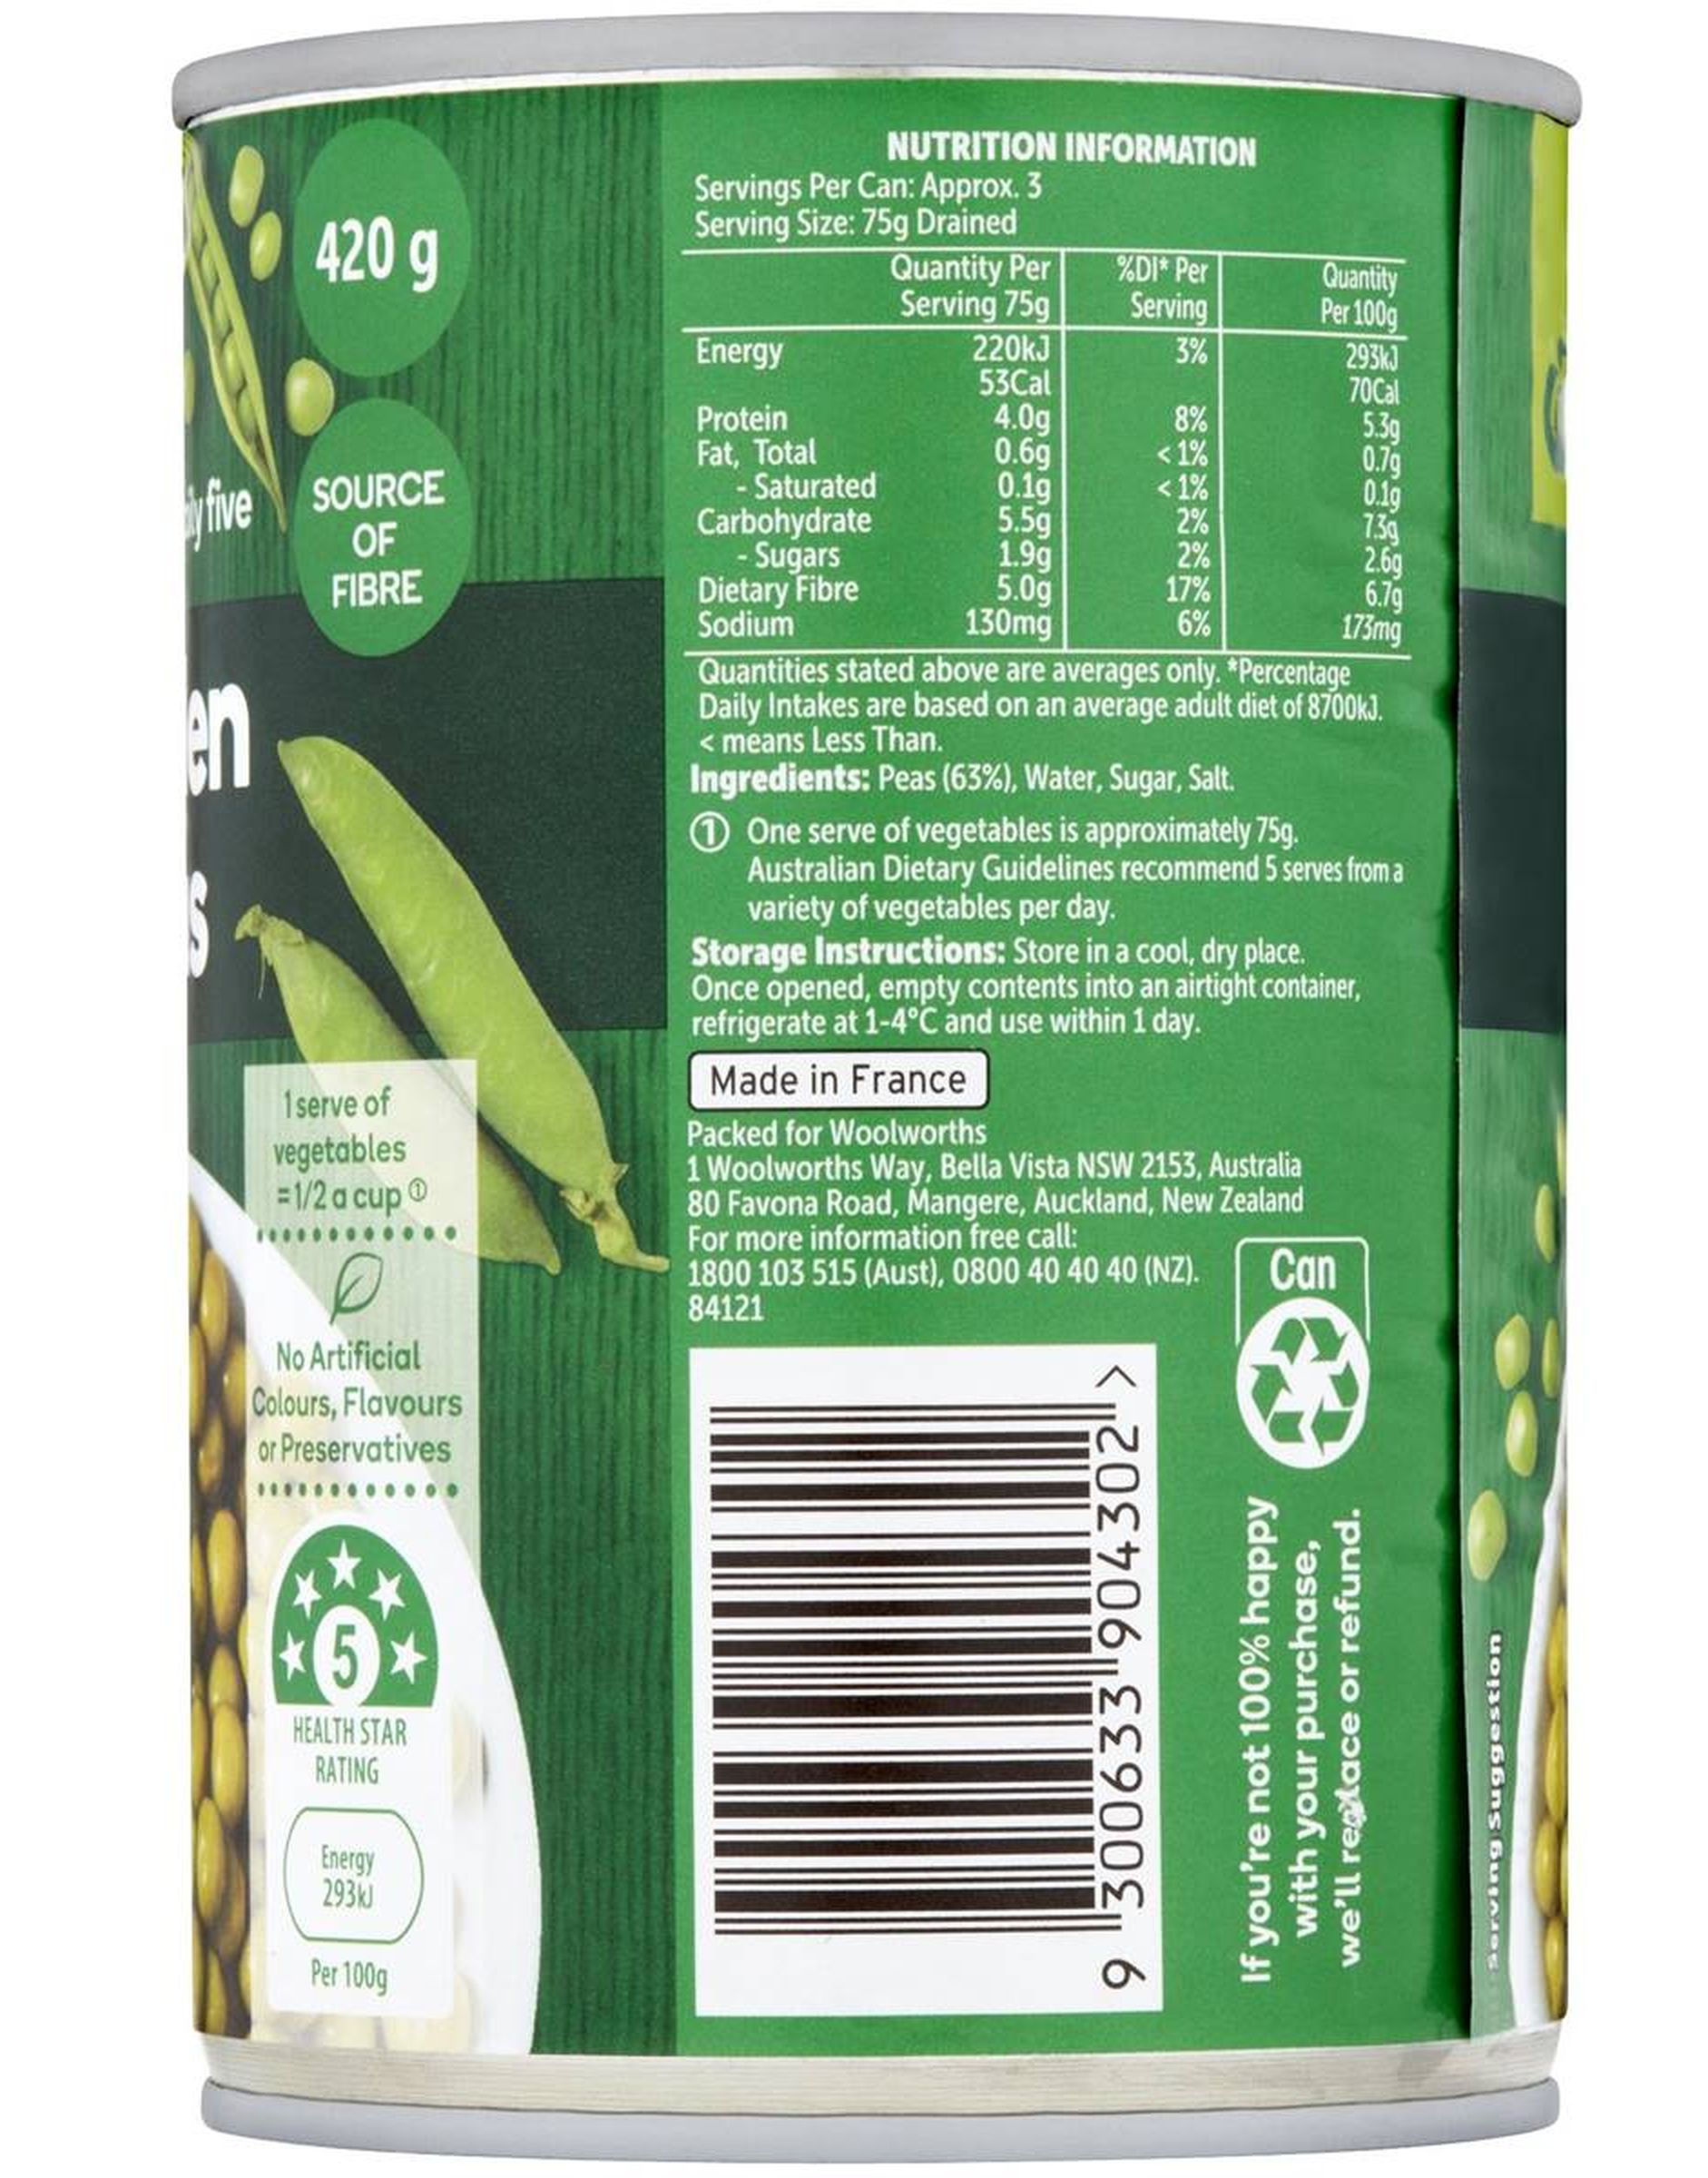 Open full size
Ingredients
Peas (63%), Water
63% vegetables by the pack’s own declaration
Where it ranks
Compared head-to-head
vs Batchelors Mushy Peas Canned Original 300g vs Batchelors Mushy Peas Canned Chip Shop 300g vs Edgell Green Peas Green 220g vs Macro Organic Garden Peas 420g vs Farrows Giant Marrowfat Peas 300g
See all 124 canned veg products with verified nutrition, the canned veg rankings or every head-to-head comparison.