Cals › Nuts & dried fruit › Compare › Lucky Natural Seed Mix With Pine Nuts 200g vs Macro LSA Mix 250g
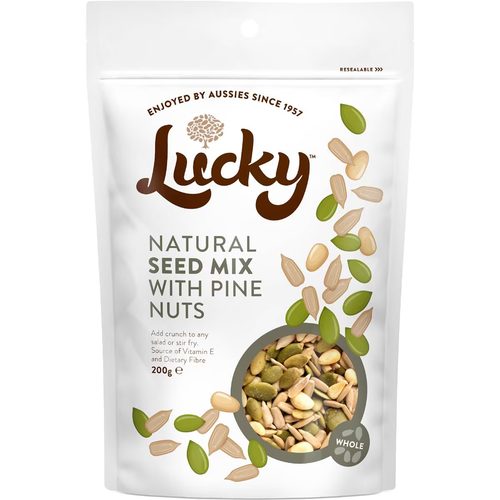
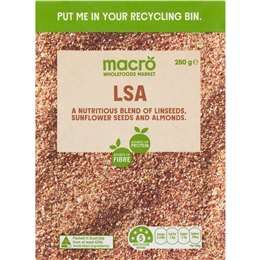
Lucky Natural Seed Mix With Pine Nuts 200g vs Macro LSA Mix 250g
Per 100 g, Macro LSA Mix 250g has more nuts (15% vs 10%), less sugar (1.5 vs 1.9), less saturated fat (3.8 vs 5.7) than Lucky Natural Seed Mix With Pine Nuts 200g.
Same aisle, measurably different composition. Every number is verified against independent supplier feeds and the labels photographed on pack.
Protein (higher)
26 vs 22.4 g
Carbohydrate (lower)
2.8 vs 3.3 g
Sodium (lower)
1 vs 30 mg
Macro LSA Mix 250g leads on
Energy (lower)
2130 vs 2370 kJ
Fat, total (lower)
40.8 vs 49 g
saturated (lower)
3.8 vs 5.7 g
sugars (lower)
1.5 vs 1.9 g
Dietary fibre (higher)
22.6 vs 8.4 g
More nuts
15% vs 10%
Side by side, per 100 g
| Value | Lucky | Macro |
|---|---|---|
| Energy | 2370 kJ (566 Cal) | 2130 kJ (509 Cal) |
| Protein | 26 g | 22.4 g |
| Fat, total | 49 g | 40.8 g |
| - saturated | 5.7 g | 3.8 g |
| - monounsaturated | 14.1 g | - |
| - polyunsaturated | 26.7 g | - |
| - trans | 0 g | 0.1 g |
| Carbohydrate | 2.8 g | 3.3 g |
| - sugars | 1.9 g | 1.5 g |
| Dietary fibre | 8.4 g | 22.6 g |
| Sodium | 1 mg | 30 mg |
| Potassium | 335 mg | - |
✓ marks a difference beyond label-rounding tolerance.
What’s in each pack
Lucky: Seeds 90% (Pepitas, Sunflower Kernals), Pine Nuts 10%.
10% nuts
Macro: Linseeds (50%), Sunflower Seeds (35%), Almonds (15%).
15% nuts