Cals › Breakfast cereal › Compare › Nestle Nesquik Breakfast Cereal 310g vs Uncle Tobys Fruity Bites Wildberry Flavour Breakfast Cereal 500g
Nestle Nesquik Breakfast Cereal 310g vs Uncle Tobys Fruity Bites Wildberry Flavour Breakfast Cereal 500g
Per 100 g, Uncle Tobys Fruity Bites Wildberry Flavour Breakfast Cereal 500g has less sugar (24.4 vs 24.9), less sodium (43 vs 91), less saturated fat (0.4 vs 0.8) than Nestle Nesquik Breakfast Cereal 310g.
Same aisle, measurably different composition. Every number is verified against independent supplier feeds and the labels photographed on pack.
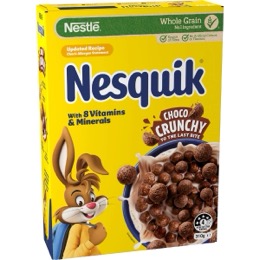
Nestle Nesquik Breakfast Cereal 310g52% wholegrain
vs
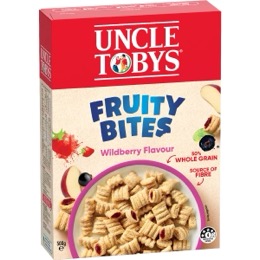
Uncle Tobys Fruity Bites Wildberry Flavour Breakfast Cereal 500g52% wholegrain
Nestle Nesquik Breakfast Cereal 310g leads on
Dietary fibre (higher)
8.9 vs 7.2 g
Energy (lower)
1500 vs 1590 kJ
Fat, total (lower)
2.1 vs 3 g
saturated (lower)
0.4 vs 0.8 g
Sodium (lower)
43 vs 91 mg
Side by side, per 100 g
| Value | Nestle | Uncle Tobys |
|---|---|---|
| Energy | 1590 kJ (380 Cal) | 1500 kJ (359 Cal) |
| Protein | 7.5 g | 7.6 g |
| Fat, total | 3 g | 2.1 g |
| - saturated | 0.8 g | 0.4 g |
| Carbohydrate | 75 g | 72.1 g |
| - sugars | 24.9 g | 24.4 g |
| Dietary fibre | 8.9 g | 7.2 g |
| Sodium | 91 mg | 43 mg |
✓ marks a difference beyond label-rounding tolerance.
What’s in each box
Nestle: Cereals Whole Grain Wheat (52%), Wheat Flour And/Or Wheat Starch, Sugar, Cocoa (5%), Glucose, Vegetable Oil, Salt, Natural Flavour. Vitamins and Minerals Minera
52% wholegrain
Uncle Tobys: Contains Gluten Containing Ingredients Whol e Grain Cereals (52%) Wheat (40%), Oats (12%), Fruit Paste Concentrated Apple Puree, Berry Puree (2.5%) (Strawberry,
52% wholegrain