Cals › Breakfast cereal › Compare › Nestle Milo Breakfast Cereal 620g vs Nestle Nesquik Breakfast Cereal 310g
Nestle Milo Breakfast Cereal 620g vs Nestle Nesquik Breakfast Cereal 310g
Per 100 g, Nestle Nesquik Breakfast Cereal 310g has less sodium (91 vs 115), less saturated fat (0.8 vs 1.4) than Nestle Milo Breakfast Cereal 620g.
Same aisle, measurably different composition. Every number is verified against independent supplier feeds and the labels photographed on pack.
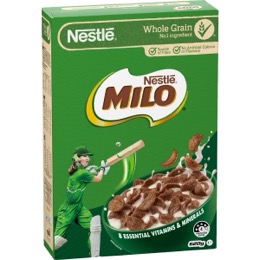
Nestle Milo Breakfast Cereal 620g55% wholegrain
vs
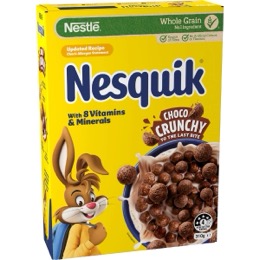
Nestle Nesquik Breakfast Cereal 310g52% wholegrain
Nestle Nesquik Breakfast Cereal 310g leads on
Fat, total (lower)
3 vs 3.8 g
saturated (lower)
0.8 vs 1.4 g
Sodium (lower)
91 vs 115 mg
Side by side, per 100 g
| Value | Nestle | Nestle |
|---|---|---|
| Energy | 1590 kJ (380 Cal) | 1590 kJ (380 Cal) |
| Protein | 8.7 g | 7.5 g |
| Fat, total | 3.8 g | 3 g |
| - saturated | 1.4 g | 0.8 g |
| Carbohydrate | 72.2 g | 75 g |
| - sugars | 23.9 g | 24.9 g |
| Dietary fibre | 8.9 g | 8.9 g |
| Sodium | 115 mg | 91 mg |
✓ marks a difference beyond label-rounding tolerance.
What’s in each box
Nestle: Cereals Whole Grain Wheat (55%), Wheat Flour And/Or Wheat Starch, Sugar, Formulated Supplementary Food Base: Milo (9%) Malt Extract (Rice And/Or Barley), Milk P
55% wholegrain
Nestle: Cereals Whole Grain Wheat (52%), Wheat Flour And/Or Wheat Starch, Sugar, Cocoa (5%), Glucose, Vegetable Oil, Salt, Natural Flavour. Vitamins and Minerals Minera
52% wholegrain