Cals › Bread › Compare › Buttercup Country Split White Bread 450g vs Coles I'm Free From Traditional White Loaf
Buttercup Country Split White Bread 450g vs Coles I'm Free From Traditional White Loaf
Per 100 g, Buttercup Country Split White Bread 450g has less sugar (2.8 vs 4), less saturated fat (1 vs 1.4), more protein (10.7 vs 3.1) than Coles I'm Free From Traditional White Loaf.
Same aisle, measurably different composition. Every number is verified against independent supplier feeds and the labels photographed on pack.
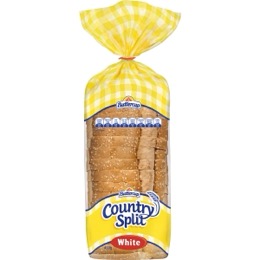
Buttercup Country Split White Bread 450gButtercup
vs
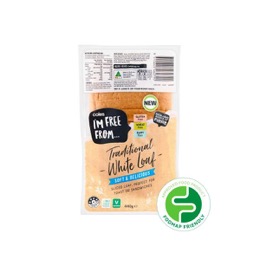
Coles I'm Free From Traditional White LoafColes I'm Free From
Protein (higher)
10.7 vs 3.1 g
Fat, total (lower)
3.1 vs 5.9 g
saturated (lower)
1 vs 1.4 g
sugars (lower)
2.8 vs 4 g
Carbohydrate (lower)
41.6 vs 44.6 g
Dietary fibre (higher)
11.4 vs 3 g
Side by side, per 100 g
| Value | Buttercup | Coles I'm Free From |
|---|---|---|
| Energy | 1080 kJ (258 Cal) | 1070 kJ (256 Cal) |
| Protein | 10.7 g | 3.1 g |
| Fat, total | 3.1 g | 5.9 g |
| - saturated | 1 g | 1.4 g |
| - trans | - | 0.1 g |
| Carbohydrate | 44.6 g | 41.6 g |
| - sugars | 2.8 g | 4 g |
| Dietary fibre | 3 g | 11.4 g |
| Sodium | 400 mg | 380 mg |
✓ marks a difference beyond label-rounding tolerance.
What’s in each loaf
Buttercup: Wheat Flour, Water, Yeast, Wheat Gluten, Sesame Seeds, Vinegar, Canola Oil, Iodised Salt, Cultured Wheat Flour, Soy Flour, Vegetable Emulsifier (471, 481), Vita
Coles I'm Free From: see pack