Cals › Baking › Compare › Coles Simply Buttermilk Pancake Shake Mix vs Green's Temptations Choc Chip Buttermilk Pancake Shake 335g
Coles Simply Buttermilk Pancake Shake Mix vs Green's Temptations Choc Chip Buttermilk Pancake Shake 335g
Per 100 g, Coles Simply Buttermilk Pancake Shake Mix has less sugar (15.4 vs 16.1), less sodium (286 vs 390), less saturated fat (0.5 vs 1.8) than Green's Temptations Choc Chip Buttermilk Pancake Shake 335g.
Same aisle, measurably different composition. Every number is verified against independent supplier feeds and the labels photographed on pack.
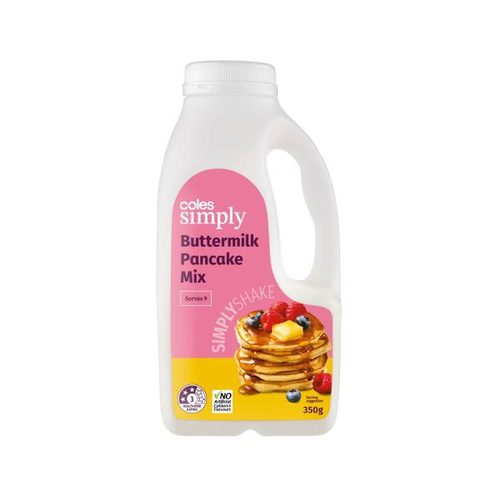
Coles Simply Buttermilk Pancake Shake MixColes Simply
vs
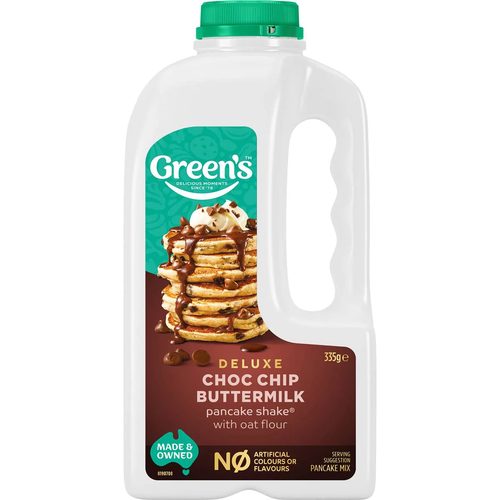
Green's Temptations Choc Chip Buttermilk Pancake Shake 335gGreen's
Fat, total (lower)
2.9 vs 4.1 g
saturated (lower)
0.5 vs 1.8 g
Sodium (lower)
286 vs 390 mg
Energy (lower)
890 vs 920 kJ
Protein (higher)
4.7 vs 3.7 g
Carbohydrate (lower)
37.5 vs 43.4 g
Side by side, per 100 g
| Value | Coles Simply | Green's |
|---|---|---|
| Energy | 920 kJ (220 Cal) | 890 kJ (213 Cal) |
| Protein | 3.7 g | 4.7 g |
| Fat, total | 2.9 g | 4.1 g |
| - saturated | 0.5 g | 1.8 g |
| Carbohydrate | 43.4 g | 37.5 g |
| - sugars | 15.4 g | 16.1 g |
| Dietary fibre | 1.5 g | - |
| Sodium | 286 mg | 390 mg |
✓ marks a difference beyond label-rounding tolerance.
What’s in each pack
Coles Simply: see pack
Green's: Oat flour, wholemeal wheat flour, chocolate chips (10%) [sugar, cocoa liquor, cocoa butter, cocoa po wder, emulsifier (soy lecithin), natural flavour, milk soli