Cals › Baking › Compare › Betty Crocker Vanilla Frosting 400g vs WHITE MILL Triple Choc Fudge Brownie Mix 500g
Betty Crocker Vanilla Frosting 400g vs WHITE MILL Triple Choc Fudge Brownie Mix 500g
Per 100 g, WHITE MILL Triple Choc Fudge Brownie Mix 500g has less sugar (62.2 vs 69.2), less saturated fat (5.4 vs 8.5), more protein (4.9 vs 1) than Betty Crocker Vanilla Frosting 400g.
Same aisle, measurably different composition. Every number is verified against independent supplier feeds and the labels photographed on pack.

Betty Crocker Vanilla Frosting 400gBetty Crocker
vs
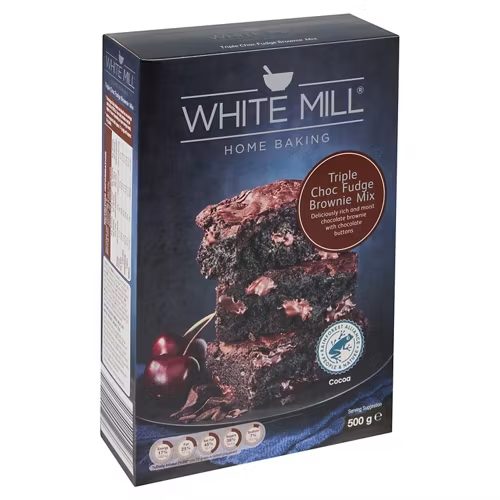
WHITE MILL Triple Choc Fudge Brownie Mix 500gWHITE MILL
Betty Crocker Vanilla Frosting 400g leads on
Carbohydrate (lower)
71.5 vs 75.4 g
Protein (higher)
4.9 vs 1 g
Fat, total (lower)
9.9 vs 15.5 g
saturated (lower)
5.4 vs 8.5 g
sugars (lower)
62.2 vs 69.2 g
Side by side, per 100 g
| Value | Betty Crocker | WHITE MILL |
|---|---|---|
| Energy | 1790 kJ (428 Cal) | 1760 kJ (421 Cal) |
| Protein | 1 g | 4.9 g |
| Fat, total | 15.5 g | 9.9 g |
| - saturated | 8.5 g | 5.4 g |
| Carbohydrate | 71.5 g | 75.4 g |
| - sugars | 69.2 g | 62.2 g |
| Dietary fibre | 1 g | - |
| Sodium | 242 mg | 244 mg |
✓ marks a difference beyond label-rounding tolerance.
What’s in each pack
Betty Crocker: Sugar, Vegetable Oil, Water, Invert Sugar Syrup, E mulsifiers (Mono- and Di-Glycerides of Fatty Acids, Polysorbate 60, Sodium Stearoyl Lactylate), Salt, Preserv
WHITE MILL: see pack