Cals › Soup › Compare › Fodmapped Chicken & Vegetable Soup vs Strength Meals Co Chicken & Sweet Corn Soup 400g
Fodmapped Chicken & Vegetable Soup vs Strength Meals Co Chicken & Sweet Corn Soup 400g
Per 100 g, Strength Meals Co Chicken & Sweet Corn Soup 400g has less sugar (1.7 vs 2.6), less sodium (204 vs 268) than Fodmapped Chicken & Vegetable Soup.
Same aisle, measurably different composition. Every number is verified against independent supplier feeds and the labels photographed on pack.
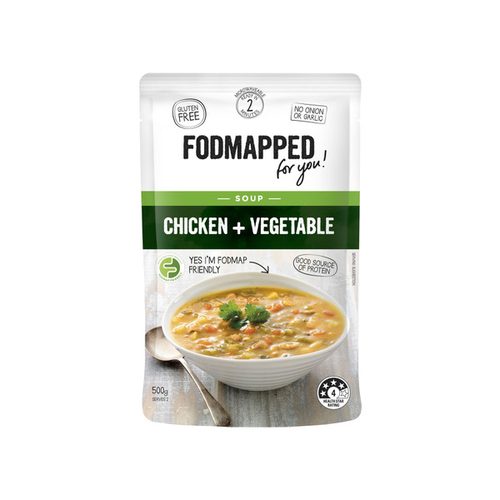
Fodmapped Chicken & Vegetable Soup18% vegetables
vs
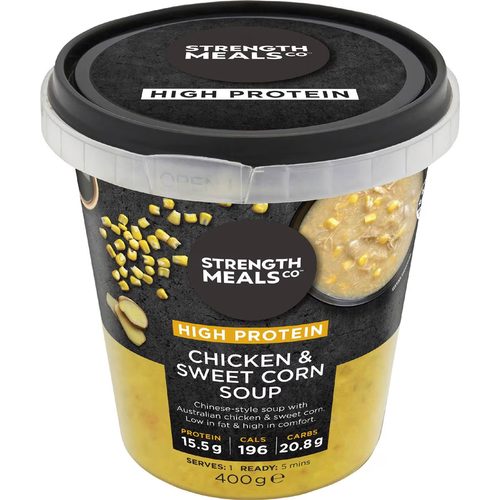
Strength Meals Co Chicken & Sweet Corn Soup 400g15% vegetables
Energy (lower)
204 vs 299 kJ
Fat, total (lower)
1.1 vs 1.5 g
Carbohydrate (lower)
5.2 vs 8.7 g
sugars (lower)
1.7 vs 2.6 g
Sodium (lower)
204 vs 268 mg
Side by side, per 100 g
| Value | Fodmapped | Strength Meals Co |
|---|---|---|
| Energy | 299 kJ (71 Cal) | 204 kJ (49 Cal) |
| Protein | 5.2 g | 3.9 g |
| Fat, total | 1.5 g | 1.1 g |
| - saturated | 0.3 g | 0.3 g |
| Carbohydrate | 8.7 g | 5.2 g |
| - sugars | 2.6 g | 1.7 g |
| Dietary fibre | 0.9 g | 1 g |
| Sodium | 268 mg | 204 mg |
✓ marks a difference beyond label-rounding tolerance.
What’s in each can
Fodmapped: Water, Pumpkin (18%), Chicken (11%), Carrots (11%), Potato (8%), Celery (7%), Brown Rice, Corn Starch, Glucose, Salt, Canola Oil, Yeast Extract, Herbs, Black Pe
18% vegetables
Strength Meals Co: Water, Chicken (15%), Sweet Corn (15%), Potato, Onion, Ginger, Garlic, Tapioca Flour, Soy Sauce (Wheat) (1%), Chicken Flavoured Stock Powder (Soy), Soy Protein,
15% vegetables