Cals › Protein bars › Compare › HILLCREST Protein Bars Salted Caramel 5 Pack 200g vs Quest Bar Choc Chip Cookie Dough 60g
HILLCREST Protein Bars Salted Caramel 5 Pack 200g vs Quest Bar Choc Chip Cookie Dough 60g
Per 100 g, Quest Bar Choc Chip Cookie Dough 60g has less sugar (1.2 vs 22.5), less sodium (361 vs 475), less saturated fat (4.6 vs 6.1) than HILLCREST Protein Bars Salted Caramel 5 Pack 200g.
Same aisle, measurably different composition. Every number is verified against independent supplier feeds and the labels photographed on pack.
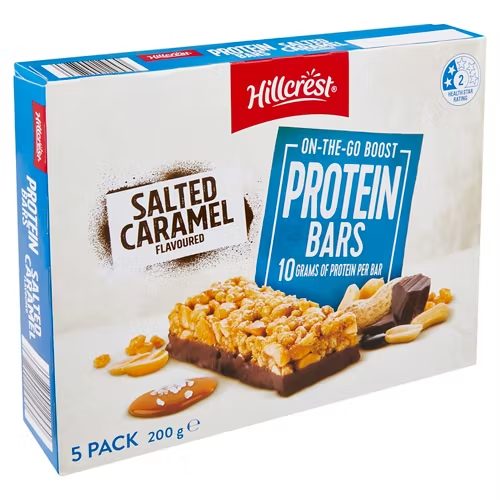
HILLCREST Protein Bars Salted Caramel 5 Pack 200g36% protein blend
vs
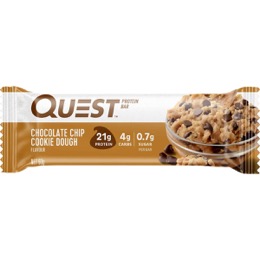
Quest Bar Choc Chip Cookie Dough 60g36% protein blend
no measured leads
Quest Bar Choc Chip Cookie Dough 60g leads on
Energy (lower)
1350 vs 2030 kJ
Protein (higher)
35 vs 25.9 g
Fat, total (lower)
14 vs 24.8 g
saturated (lower)
4.6 vs 6.1 g
Carbohydrate (lower)
7 vs 38.5 g
sugars (lower)
1.2 vs 22.5 g
Sodium (lower)
361 vs 475 mg
Side by side, per 100 g
| Value | HILLCREST | Quest |
|---|---|---|
| Energy | 2030 kJ (485 Cal) | 1350 kJ (323 Cal) |
| Protein | 25.9 g | 35 g |
| Fat, total | 24.8 g | 14 g |
| - saturated | 6.1 g | 4.6 g |
| Carbohydrate | 38.5 g | 7 g |
| - sugars | 22.5 g | 1.2 g |
| Dietary fibre | - | 20 g |
| Sodium | 475 mg | 361 mg |
✓ marks a difference beyond label-rounding tolerance.
What’s in each bar
HILLCREST: see pack
36% protein blend
Quest: see pack
36% protein blend