Cals › Nuts & dried fruit › Compare › Macro Roasted Nuts Mix 500g vs Wallaby Naked Bites Roasted Peanut Crunch 120g
Macro Roasted Nuts Mix 500g vs Wallaby Naked Bites Roasted Peanut Crunch 120g
Per 100 g, Macro Roasted Nuts Mix 500g has more nuts (34% vs 27%), less sugar (4.6 vs 17.5), less sodium (6 vs 371) than Wallaby Naked Bites Roasted Peanut Crunch 120g.
Same aisle, measurably different composition. Every number is verified against independent supplier feeds and the labels photographed on pack.
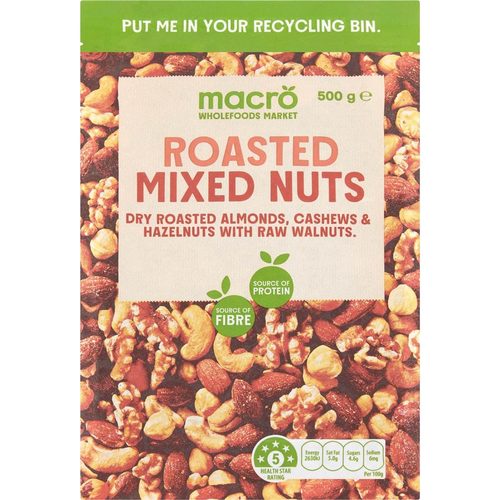
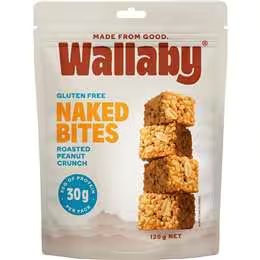
Macro Roasted Nuts Mix 500g leads on
saturated (lower)
5 vs 7.2 g
Carbohydrate (lower)
8 vs 33.5 g
sugars (lower)
4.6 vs 17.5 g
Sodium (lower)
6 vs 371 mg
More nuts
34% vs 27%
Energy (lower)
2062 vs 2630 kJ
Protein (higher)
25.3 vs 17.4 g
Fat, total (lower)
28.4 vs 57.7 g
Side by side, per 100 g
| Value | Macro | Wallaby |
|---|---|---|
| Energy | 2630 kJ (629 Cal) | 2062 kJ (493 Cal) |
| Protein | 17.4 g | 25.3 g |
| Fat, total | 57.7 g | 28.4 g |
| - saturated | 5 g | 7.2 g |
| - trans | 0.1 g | - |
| Carbohydrate | 8 g | 33.5 g |
| - sugars | 4.6 g | 17.5 g |
| Dietary fibre | 7.9 g | - |
| Sodium | 6 mg | 371 mg |
✓ marks a difference beyond label-rounding tolerance.
What’s in each pack
Macro: Almonds (34%), Cashews (27%), Hazelnuts (20%), Walnuts (18%).
34% nuts
Wallaby: Peanut Flour (27%), Rice Malt Syrup, Toasted Peanut Pieces (20%), Soy Protein Crisps (Soy Protein Isolate, Tapioca Starch, Salt), Sugar, Vegetable Oil, Sea Salt
27% nuts