Macro Australian Raisins 400g vs Sunbeam Mixed Fruit 375g
Per 100 g, Macro Australian Raisins 400g has less sugar (66.6 vs 66.8), more protein (3.3 vs 2.1) than Sunbeam Mixed Fruit 375g.
Same aisle, measurably different composition. Every number is verified against independent supplier feeds and the labels photographed on pack.
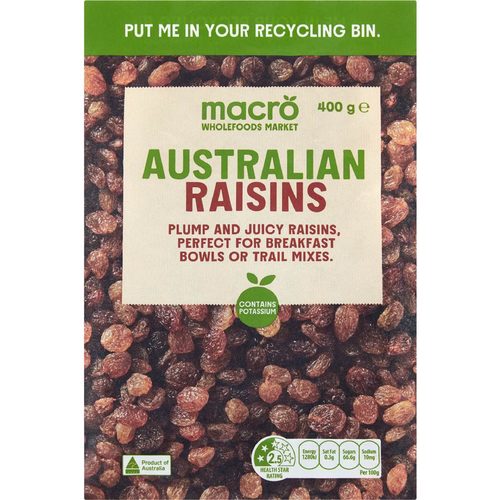
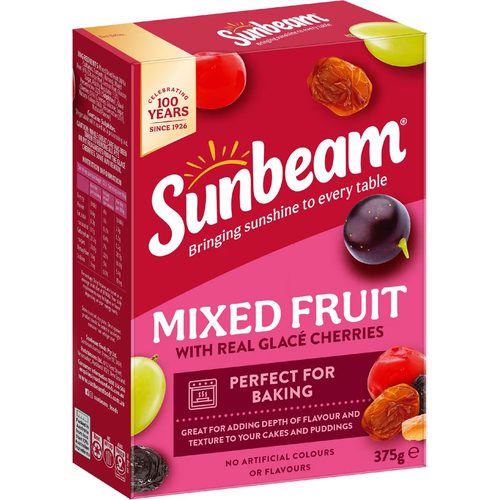
Macro Australian Raisins 400g leads on
Protein (higher)
3.3 vs 2.1 g
Sunbeam Mixed Fruit 375g leads on
Dietary fibre (higher)
5.4 vs 2.8 g
Side by side, per 100 g
| Value | Macro | Sunbeam |
|---|---|---|
| Energy | 1280 kJ (306 Cal) | 1300 kJ (311 Cal) |
| Protein | 3.3 g | 2.1 g |
| Fat, total | 1 g | - |
| - saturated | 1 g | - |
| Carbohydrate | 68.4 g | 70.7 g |
| - sugars | 66.6 g | 66.8 g |
| Dietary fibre | 2.8 g | 5.4 g |
| Sodium | 10 mg | 10 mg |
| Potassium | 677 mg | - |
✓ marks a difference beyond label-rounding tolerance.
What’s in each pack
Macro: Raisins (99%), Canola Oil.
Sunbeam: Mixed Dried Fruit (88%)(Sultanas, Currants, Raisin s), Mixed Peel [Orange Peel, Lemon Peel, Glucose, Sugar, Acidity Regulator (330), Preservative(223)( Sulphite