Cals › Fish fingers & nuggets › Compare › Blueline Seafood Salt & Pepper Squid 360g vs OCEAN ROYALE Golden Crisp Fish Fillets – Lemon Crumb 425g
Blueline Seafood Salt & Pepper Squid 360g vs OCEAN ROYALE Golden Crisp Fish Fillets – Lemon Crumb 425g
Per 100 g, Blueline Seafood Salt & Pepper Squid 360g has less sugar (0.9 vs 4.3), more protein (11.4 vs 10.8) than OCEAN ROYALE Golden Crisp Fish Fillets – Lemon Crumb 425g.
Same aisle, measurably different composition. Every number is verified against independent supplier feeds and the labels photographed on pack.
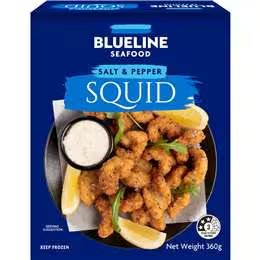
Blueline Seafood Salt & Pepper Squid 360gBlueline Seafood
vs
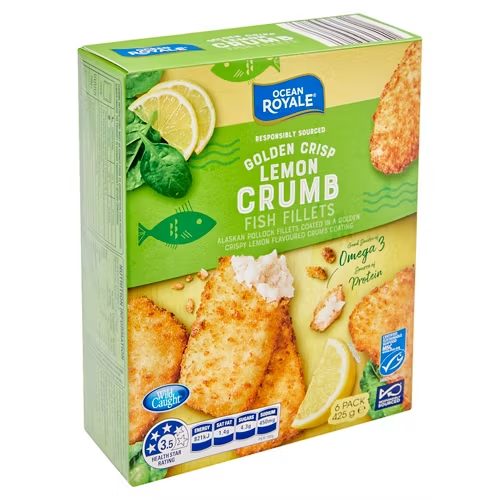
OCEAN ROYALE Golden Crisp Fish Fillets – Lemon Crumb 425gOCEAN ROYALE
Protein (higher)
11.4 vs 10.8 g
Carbohydrate (lower)
11.4 vs 19.2 g
sugars (lower)
0.9 vs 4.3 g
Fat, total (lower)
7.6 vs 11.5 g
saturated (lower)
1.4 vs 1.7 g
Sodium (lower)
450 vs 583 mg
Side by side, per 100 g
| Value | Blueline Seafood | OCEAN ROYALE |
|---|---|---|
| Energy | 826 kJ (197 Cal) | 821 kJ (196 Cal) |
| Protein | 11.4 g | 10.8 g |
| Fat, total | 11.5 g | 7.6 g |
| - saturated | 1.7 g | 1.4 g |
| - monounsaturated | - | 1.6 g |
| - polyunsaturated | - | 4.6 g |
| - trans | - | 0.1 g |
| Carbohydrate | 11.4 g | 19.2 g |
| - sugars | 0.9 g | 4.3 g |
| Sodium | 583 mg | 450 mg |
✓ marks a difference beyond label-rounding tolerance.
What’s in each box
Blueline Seafood: Wild Caught Squid (Mollusc) (60%) (Squid (Dosidicus gigas), Acidity Regulators (330, 331), Salt), Coating (40%) (Wheat Flour, Wheat Starch, Rice Flour, Wheat Gl
OCEAN ROYALE: see pack