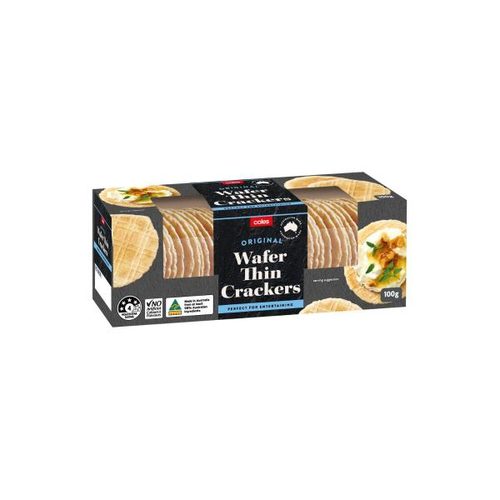
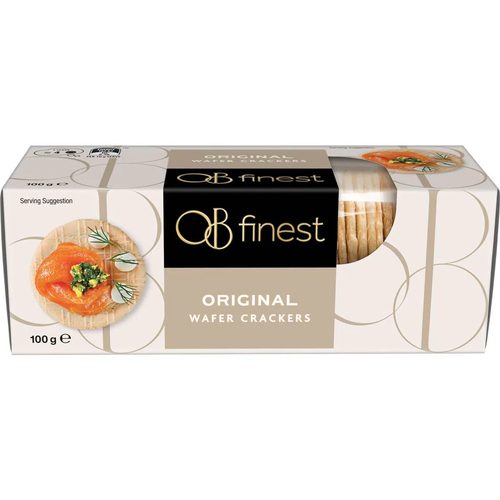
Coles Wafer Crackers vs OB Finest Original Wafer Crackers 100g
Per 100 g, Coles Wafer Crackers has less sugar (1.1 vs 1.2), less sodium (410 vs 598), less saturated fat (0.7 vs 1.1) than OB Finest Original Wafer Crackers 100g.
Same aisle, measurably different composition. Every number is verified against independent supplier feeds and the labels photographed on pack.
Fat, total (lower)
3.4 vs 4.7 g
Side by side, per 100 g
| Value | Coles | OB Finest |
|---|---|---|
| Energy | 1670 kJ (399 Cal) | 1670 kJ (399 Cal) |
| Protein | 9.8 g | 9.8 g |
| Fat, total | 4.7 g | 3.4 g |
| - saturated | 0.7 g | 1.1 g |
| Carbohydrate | 76.1 g | 79.8 g |
| - sugars | 1.1 g | 1.2 g |
| Dietary fibre | 4.1 g | - |
| Sodium | 410 mg | 598 mg |
✓ marks a difference beyond label-rounding tolerance.
What’s in each box
Coles: Wheat Flour, Canola Oil, Iodised Salt, Tasty Cheese Powder [Milk Solids, Cheese Solids (Pasteurised Milk, Salt, Starter Culture (Milk), Enzyme), Salt, Acidity R
OB Finest: Wheat Flour, Cheese Powder Milk Solids, Cheese Solids (Milk, Salt, Starter Culture, Enzymes), Salt, Acidity Regulator (330), Salt, Canola Oil, Raising Agent (50