Squid Brand Fish Sauce 300mL vs Tiparos Fish Sauce 700mL
Per 100 g, Squid Brand Fish Sauce 300mL has less sugar (3.4 vs 4.4), less saturated fat (0 vs 0.05), more protein (10.4 vs 6.8) than Tiparos Fish Sauce 700mL.
Same aisle, measurably different composition. Every number is verified against independent supplier feeds and the labels photographed on pack.
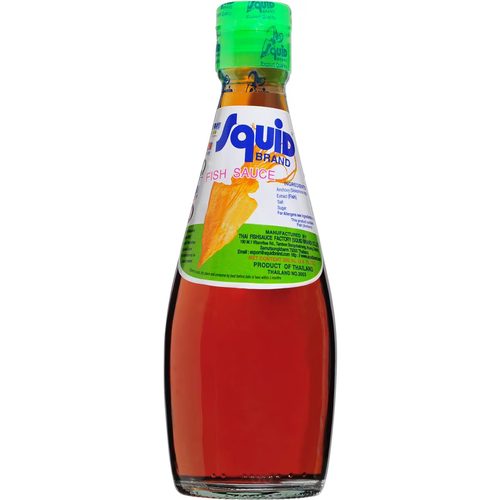
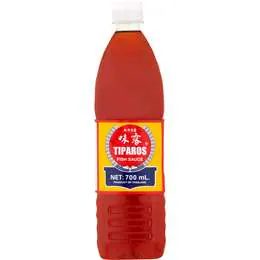
Squid Brand Fish Sauce 300mL leads on
Protein (higher)
10.4 vs 6.8 g
Carbohydrate (lower)
3.4 vs 4.4 g
sugars (lower)
3.4 vs 4.4 g
Side by side, per 100 g
| Value | Squid Brand | Tiparos |
|---|---|---|
| Energy | 230 kJ (55 Cal) | 213 kJ (51 Cal) |
| Protein | 10.4 g | 6.8 g |
| Fat, total | 0.1 g | 0.3 g |
| - saturated | 0 g | 0.05 g |
| - monounsaturated | 0.09 g | 0.09 g |
| - polyunsaturated | 0.07 g | 0.07 g |
| - trans | 0 g | 0 g |
| Carbohydrate | 3.4 g | 4.4 g |
| - sugars | 3.4 g | 4.4 g |
| Dietary fibre | 1.2 g | 1.2 g |
| Sodium | 9750 mg | 8255 mg |
| Potassium | 215 mg | 215 mg |
✓ marks a difference beyond label-rounding tolerance.
What’s in each jar
Squid Brand: Anchovy (Fish) (Encrasicholina spp.) 77%, Salt 20%, Sugar 3%
Tiparos: see pack