Cals › Chips › Compare › Popcorners Chips Cinnamon Crunch 130g vs Sunbites Grain Waves Wholegrain Chips Cheddar 170g
Popcorners Chips Cinnamon Crunch 130g vs Sunbites Grain Waves Wholegrain Chips Cheddar 170g
Per 100 g, Sunbites Grain Waves Wholegrain Chips Cheddar 170g has less sugar (6.8 vs 11.1), less saturated fat (2.1 vs 4.2), more protein (7.5 vs 4.9) than Popcorners Chips Cinnamon Crunch 130g.
Same aisle, measurably different composition. Every number is verified against independent supplier feeds and the labels photographed on pack.
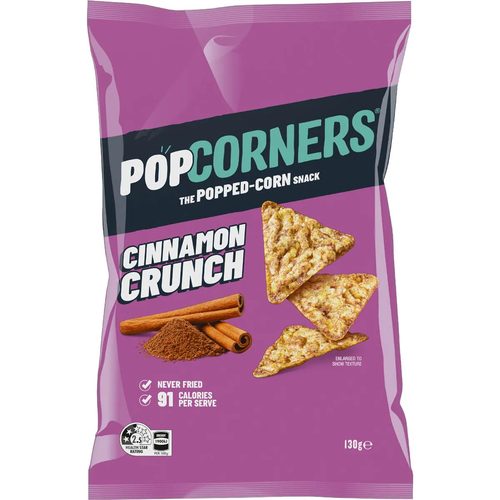
Popcorners Chips Cinnamon Crunch 130gPopcorners
vs
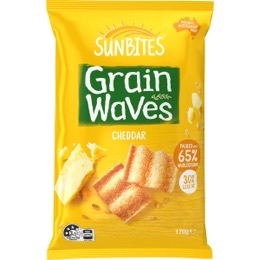
Sunbites Grain Waves Wholegrain Chips Cheddar 170gSunbites
Energy (lower)
1900 vs 2020 kJ
Fat, total (lower)
18.4 vs 22.1 g
Sodium (lower)
142 vs 350 mg
Protein (higher)
7.5 vs 4.9 g
saturated (lower)
2.1 vs 4.2 g
monounsaturated (higher)
12.5 vs 7.8 g
polyunsaturated (higher)
7.1 vs 6.1 g
sugars (lower)
6.8 vs 11.1 g
Dietary fibre (higher)
6.4 vs 1.8 g
Potassium (higher)
454 vs 110 mg
Side by side, per 100 g
| Value | Popcorners | Sunbites |
|---|---|---|
| Energy | 1900 kJ (454 Cal) | 2020 kJ (483 Cal) |
| Protein | 4.9 g | 7.5 g |
| Fat, total | 18.4 g | 22.1 g |
| - saturated | 4.2 g | 2.1 g |
| - monounsaturated | 7.8 g | 12.5 g |
| - polyunsaturated | 6.1 g | 7.1 g |
| - trans | 0.1 g | 0.2 g |
| Carbohydrate | 65.5 g | 62.9 g |
| - sugars | 11.1 g | 6.8 g |
| Dietary fibre | 1.8 g | 6.4 g |
| Sodium | 142 mg | 350 mg |
| Potassium | 110 mg | 454 mg |
✓ marks a difference beyond label-rounding tolerance.
What’s in each pack
Popcorners: Corn (70%), Rice Bran Oil, Brown Sugar, Natural Flavours, Salt, Spice (Cinnanom), Natural Colours (Caramel, Paprika Extract), Antioxidant (Rosemary Extract).
Sunbites: Wholegrain Cereals (68%) (Corn (41%), Wheat (23%), Oats (4%)), Canola Oil, Sugar, Rice, Maltodextrin, Whey Powder (Milk), Cheese Powder (Milk), Salt, Yeast Extr