Cals › Chips › Compare › Mission White Strip Corn Chips 500g vs Takis Intense Nacho Tortilla Chips 190g
Mission White Strip Corn Chips 500g vs Takis Intense Nacho Tortilla Chips 190g
Per 100 g, Mission White Strip Corn Chips 500g has less sugar (1 vs 3.6), less sodium (330 vs 722), less saturated fat (2.3 vs 11.4) than Takis Intense Nacho Tortilla Chips 190g.
Same aisle, measurably different composition. Every number is verified against independent supplier feeds and the labels photographed on pack.
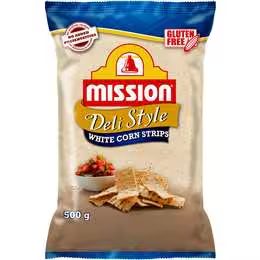
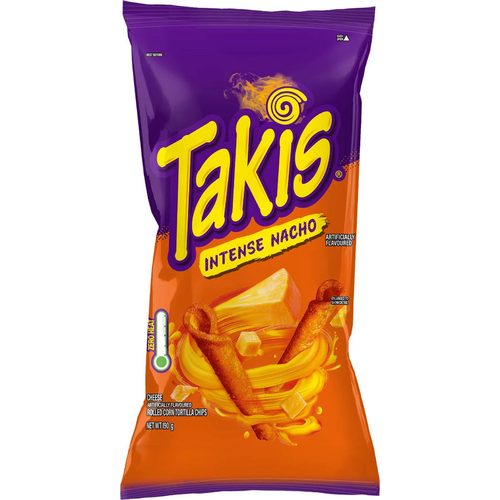
Mission White Strip Corn Chips 500g leads on
Protein (higher)
6.3 vs 5.9 g
Fat, total (lower)
26.6 vs 31 g
saturated (lower)
2.3 vs 11.4 g
sugars (lower)
1 vs 3.6 g
Dietary fibre (higher)
7.6 vs 5.6 g
Sodium (lower)
330 vs 722 mg
Carbohydrate (lower)
53.1 vs 59.4 g
Side by side, per 100 g
| Value | Mission | Takis |
|---|---|---|
| Energy | 2140 kJ (511 Cal) | 2150 kJ (514 Cal) |
| Protein | 6.3 g | 5.9 g |
| Fat, total | 26.6 g | 31 g |
| - saturated | 2.3 g | 11.4 g |
| - monounsaturated | 13.4 g | - |
| - polyunsaturated | 8 g | - |
| - trans | 0.22 g | - |
| Carbohydrate | 59.4 g | 53.1 g |
| - sugars | 1 g | 3.6 g |
| Dietary fibre | 7.6 g | 5.6 g |
| Sodium | 330 mg | 722 mg |
| Potassium | 157 mg | - |
✓ marks a difference beyond label-rounding tolerance.
What’s in each pack
Mission: Corn Flour (76%), Vegetable Oil, Water, Salt
Takis: see pack