Bhuja Beer Mix 160g vs Macro Sweet Potato Chickpea Chips 69g
Per 100 g, Macro Sweet Potato Chickpea Chips 69g has less sugar (3.3 vs 8), less sodium (326 vs 525), less saturated fat (2.4 vs 4.8) than Bhuja Beer Mix 160g.
Same aisle, measurably different composition. Every number is verified against independent supplier feeds and the labels photographed on pack.
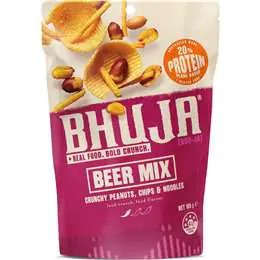
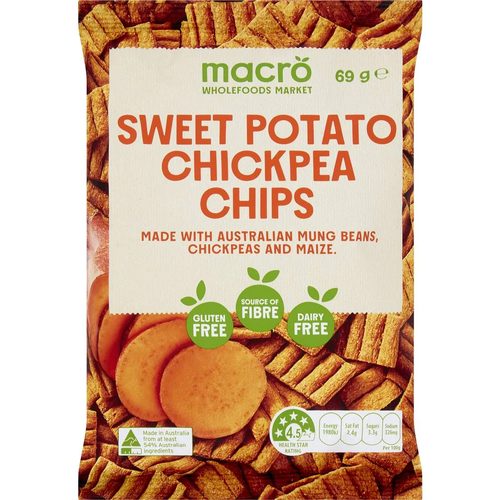
Bhuja Beer Mix 160g leads on
Protein (higher)
20.4 vs 14 g
Carbohydrate (lower)
27.1 vs 52.3 g
More potato
5% vs 4%
Energy (lower)
1980 vs 2290 kJ
Fat, total (lower)
21.1 vs 39.8 g
saturated (lower)
2.4 vs 4.8 g
sugars (lower)
3.3 vs 8 g
Sodium (lower)
326 vs 525 mg
Side by side, per 100 g
| Value | Bhuja | Macro |
|---|---|---|
| Energy | 2290 kJ (547 Cal) | 1980 kJ (473 Cal) |
| Protein | 20.4 g | 14 g |
| Fat, total | 39.8 g | 21.1 g |
| - saturated | 4.8 g | 2.4 g |
| - trans | - | 1 g |
| Carbohydrate | 27.1 g | 52.3 g |
| - sugars | 8 g | 3.3 g |
| Dietary fibre | 8.6 g | 8.7 g |
| Sodium | 525 mg | 326 mg |
✓ marks a difference beyond label-rounding tolerance.
What’s in each pack
Bhuja: Peanuts (60%), Noodles (12%) (Yellow Pea, Rice, Hi-Oleic Sunflower and/Canola Oil, Potato, Tapioca, Sesame Seeds, Salt, Cumin), Potato Crunchers Chip (5%) (Pota
5% potato
Macro: Whole Mung Bean Flour (26%), Chickpea Flour (20%), Vegetable Oils (Sunflower Oil, Canola Oil), Rice Flour, Maize Flour (12%), Chickpea Fibre, Potato Starch, Swe
4% potato