Pyengana Traditional Cheddar vs Thomas Dux Aged Dutch Gouda 200g
Per 100 g, Thomas Dux Aged Dutch Gouda 200g has less sodium (642 vs 695), more protein (28.4 vs 27.2) than Pyengana Traditional Cheddar.
Same aisle, measurably different composition. Every number is verified against independent supplier feeds and the labels photographed on pack.
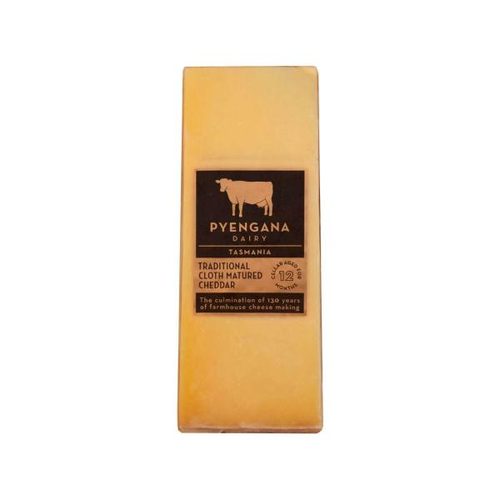
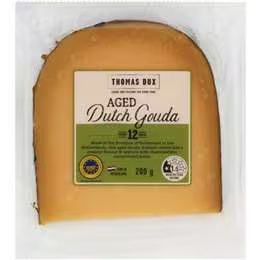
Pyengana Traditional Cheddar leads on
sugars (lower)
0.1 vs 1 g
Side by side, per 100 g
| Value | Pyengana | Thomas Dux |
|---|---|---|
| Energy | 1840 kJ (440 Cal) | 1830 kJ (437 Cal) |
| Protein | 27.2 g | 28.4 g |
| Fat, total | 36.2 g | 36.3 g |
| - saturated | 24.7 g | 25.2 g |
| - trans | - | 1 g |
| Carbohydrate | 2.3 g | 1 g |
| - sugars | 0.1 g | 1 g |
| Sodium | 695 mg | 642 mg |
✓ marks a difference beyond label-rounding tolerance.
What’s in each pack
Pyengana: see pack
Thomas Dux: Pasteurised Milk, Salt, Starter Culture, Microbial Rennet, Colour (Annatto Norbixin)