Cals › Cheese › Compare › Coles Finest Rosemary Sheep Cheese Cured 6 Months vs Pyengana Traditional Cheddar
Coles Finest Rosemary Sheep Cheese Cured 6 Months vs Pyengana Traditional Cheddar
Per 100 g, Pyengana Traditional Cheddar has less sugar (0.1 vs 0.6), less saturated fat (24.7 vs 28.4), more protein (27.2 vs 25.1) than Coles Finest Rosemary Sheep Cheese Cured 6 Months.
Same aisle, measurably different composition. Every number is verified against independent supplier feeds and the labels photographed on pack.
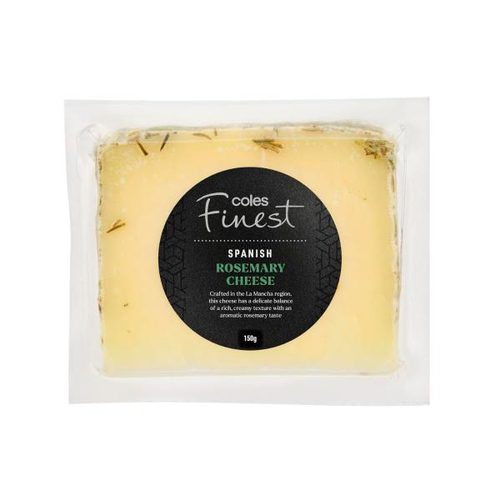
Coles Finest Rosemary Sheep Cheese Cured 6 MonthsColes Finest
vs
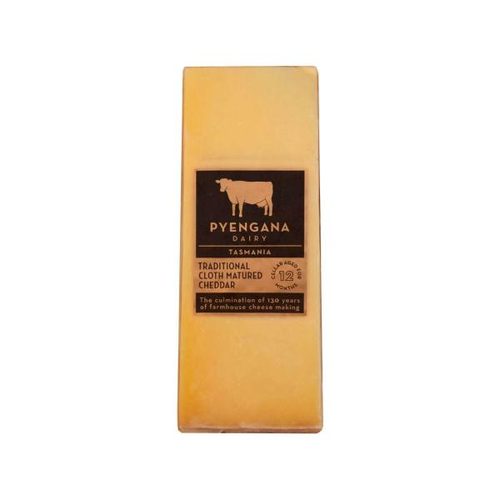
Pyengana Traditional CheddarPyengana
Carbohydrate (lower)
1.5 vs 2.3 g
Sodium (lower)
632 vs 695 mg
Pyengana Traditional Cheddar leads on
Energy (lower)
1840 vs 1930 kJ
Protein (higher)
27.2 vs 25.1 g
Fat, total (lower)
36.2 vs 39.9 g
saturated (lower)
24.7 vs 28.4 g
sugars (lower)
0.1 vs 0.6 g
Side by side, per 100 g
| Value | Coles Finest | Pyengana |
|---|---|---|
| Energy | 1930 kJ (461 Cal) | 1840 kJ (440 Cal) |
| Protein | 25.1 g | 27.2 g |
| Fat, total | 39.9 g | 36.2 g |
| - saturated | 28.4 g | 24.7 g |
| Carbohydrate | 1.5 g | 2.3 g |
| - sugars | 0.6 g | 0.1 g |
| Dietary fibre | 0.1 g | - |
| Sodium | 632 mg | 695 mg |
✓ marks a difference beyond label-rounding tolerance.
What’s in each pack
Coles Finest: see pack
Pyengana: see pack