Cals › Canned veg › Compare › Edgell Peas Corn & Carrots Corn & Carrots 420g vs Macro Organic Peas Corn & Carrots 420g
Edgell Peas Corn & Carrots Corn & Carrots 420g vs Macro Organic Peas Corn & Carrots 420g
Per 100 g, Macro Organic Peas Corn & Carrots 420g has less sugar (2.5 vs 3.7), less sodium (5 vs 237), more protein (3.2 vs 2.4) than Edgell Peas Corn & Carrots Corn & Carrots 420g.
Same aisle, measurably different composition. Every number is verified against independent supplier feeds and the labels photographed on pack.
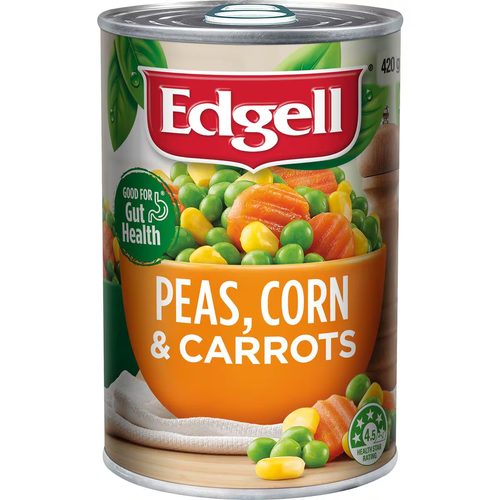
Edgell Peas Corn & Carrots Corn & Carrots 420g60% vegetables
vs
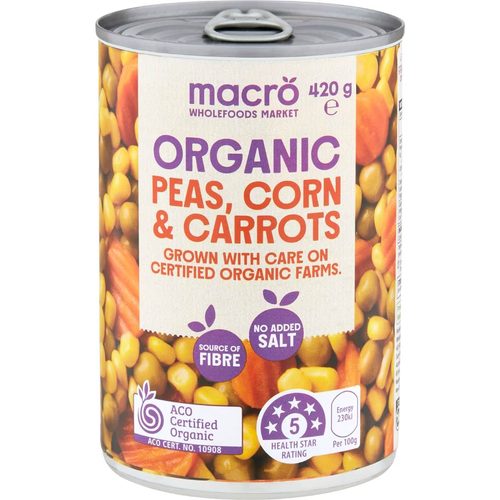
Macro Organic Peas Corn & Carrots 420g59% vegetables
saturated (lower)
0.1 vs 1 g
Dietary fibre (higher)
3.8 vs 3.5 g
More vegetables
60% vs 59%
Protein (higher)
3.2 vs 2.4 g
Carbohydrate (lower)
6.3 vs 6.9 g
sugars (lower)
2.5 vs 3.7 g
Sodium (lower)
5 vs 237 mg
Side by side, per 100 g
| Value | Edgell | Macro |
|---|---|---|
| Energy | 233 kJ (56 Cal) | 230 kJ (55 Cal) |
| Protein | 2.4 g | 3.2 g |
| Fat, total | 1.2 g | 1.1 g |
| - saturated | 0.1 g | 1 g |
| Carbohydrate | 6.9 g | 6.3 g |
| - sugars | 3.7 g | 2.5 g |
| Dietary fibre | 3.8 g | 3.5 g |
| Sodium | 237 mg | 5 mg |
| Potassium | - | 190 mg |
✓ marks a difference beyond label-rounding tolerance.
What’s in each can
Edgell: Vegetables (60%) (peas, corn, carrot), water, sugar, salt.
60% vegetables
Macro: Mixed Vegetables (59%) (Garden Peas, Corn, Carrot), Water, Ingredients and percentages may vary due to seasonal and processing variability
59% vegetables