PORTVIEW Tuna With 4 Bean Mix 160g vs Safcol Pink Salmon 210g
Per 100 g, Safcol Pink Salmon 210g has less sugar (0.1 vs 1.1), less sodium (229 vs 331), more protein (24.7 vs 11.2) than PORTVIEW Tuna With 4 Bean Mix 160g.
Same aisle, measurably different composition. Every number is verified against independent supplier feeds and the labels photographed on pack.
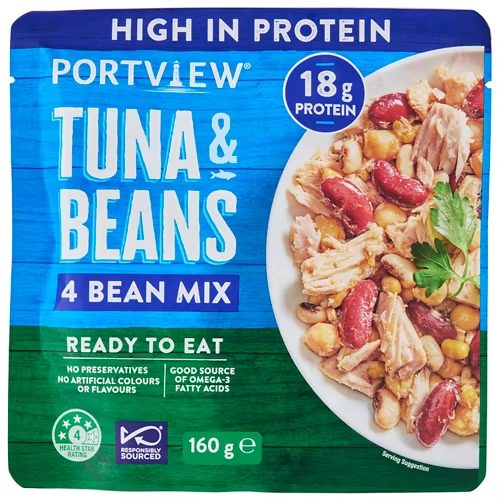
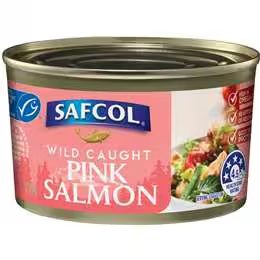
PORTVIEW Tuna With 4 Bean Mix 160g leads on
saturated (lower)
0.7 vs 1 g
monounsaturated (higher)
1.7 vs 1.1 g
polyunsaturated (higher)
2.2 vs 1.7 g
trans (lower)
0.1 vs 1 g
Safcol Pink Salmon 210g leads on
Energy (lower)
542 vs 556 kJ
Protein (higher)
24.7 vs 11.2 g
Fat, total (lower)
4.1 vs 5 g
Carbohydrate (lower)
0.1 vs 9 g
sugars (lower)
0.1 vs 1.1 g
Sodium (lower)
229 vs 331 mg
Side by side, per 100 g
| Value | PORTVIEW | Safcol |
|---|---|---|
| Energy | 556 kJ (133 Cal) | 542 kJ (130 Cal) |
| Protein | 11.2 g | 24.7 g |
| Fat, total | 5 g | 4.1 g |
| - saturated | 0.7 g | 1 g |
| - monounsaturated | 1.7 g | 1.1 g |
| - polyunsaturated | 2.2 g | 1.7 g |
| - trans | 0.1 g | 1 g |
| Carbohydrate | 9 g | 0.1 g |
| - sugars | 1.1 g | 0.1 g |
| Dietary fibre | 3.6 g | - |
| Sodium | 331 mg | 229 mg |
✓ marks a difference beyond label-rounding tolerance.
What’s in each tin
PORTVIEW: see pack
Safcol: INGREDIENTS: PINK SALMON (99%) (Fish), SALT.