Cals › Canned tuna › Compare › OCEAN RISE Yellowfin Tuna & Brown Rice Quinoa Ready Meal 190g vs PORTVIEW Tuna Power Bowl Magnesium 170g
OCEAN RISE Yellowfin Tuna & Brown Rice Quinoa Ready Meal 190g vs PORTVIEW Tuna Power Bowl Magnesium 170g
Per 100 g, PORTVIEW Tuna Power Bowl Magnesium 170g has less sodium (292 vs 428), less saturated fat (0.5 vs 0.7), more protein (12 vs 8.2) than OCEAN RISE Yellowfin Tuna & Brown Rice Quinoa Ready Meal 190g.
Same aisle, measurably different composition. Every number is verified against independent supplier feeds and the labels photographed on pack.
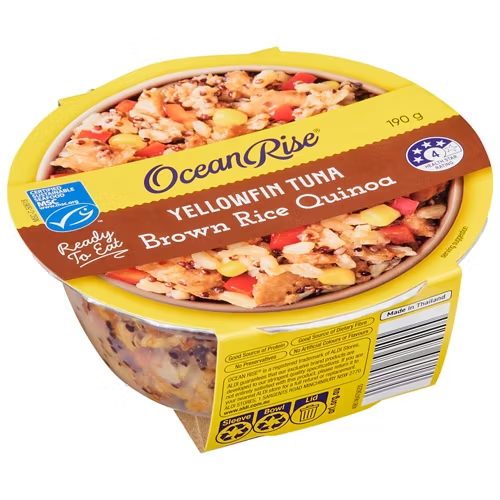
OCEAN RISE Yellowfin Tuna & Brown Rice Quinoa Ready Meal 190gOCEAN RISE
vs
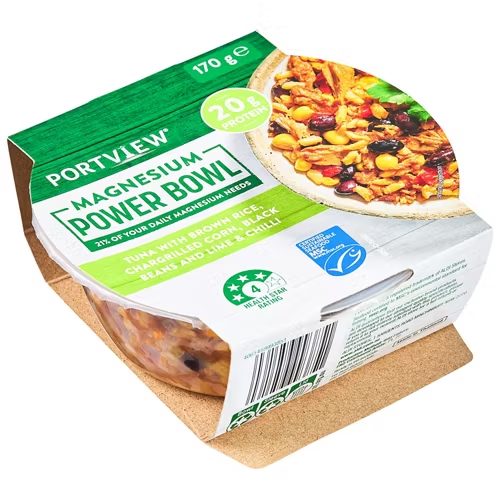
PORTVIEW Tuna Power Bowl Magnesium 170gPORTVIEW
Carbohydrate (lower)
14.4 vs 16.4 g
sugars (lower)
1.4 vs 2.4 g
Protein (higher)
12 vs 8.2 g
Fat, total (lower)
3 vs 4.9 g
Sodium (lower)
292 vs 428 mg
Side by side, per 100 g
| Value | OCEAN RISE | PORTVIEW |
|---|---|---|
| Energy | 592 kJ (141 Cal) | 602 kJ (144 Cal) |
| Protein | 8.2 g | 12 g |
| Fat, total | 4.9 g | 3 g |
| - saturated | 0.7 g | 0.5 g |
| - monounsaturated | - | 0.7 g |
| - polyunsaturated | - | 1.2 g |
| - trans | - | 0.1 g |
| Carbohydrate | 14.4 g | 16.4 g |
| - sugars | 1.4 g | 2.4 g |
| Dietary fibre | 3.4 g | - |
| Sodium | 428 mg | 292 mg |
✓ marks a difference beyond label-rounding tolerance.
What’s in each tin
OCEAN RISE: see pack
PORTVIEW: see pack