Cals › Canned fruit › Compare › Coles Whole Purple Plums In Syrup vs Goulburn Valley Fruit Topping Peach & Raspberry 315g
Coles Whole Purple Plums In Syrup vs Goulburn Valley Fruit Topping Peach & Raspberry 315g
Per 100 g, Goulburn Valley Fruit Topping Peach & Raspberry 315g has less sugar (18.5 vs 19.8), less saturated fat (0.1 vs 0.2), more protein (0.5 vs 0.3) than Coles Whole Purple Plums In Syrup.
Same aisle, measurably different composition. Every number is verified against independent supplier feeds and the labels photographed on pack.
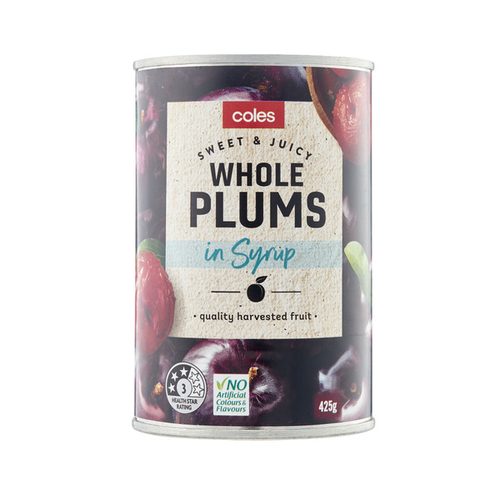
Coles Whole Purple Plums In SyrupColes
vs
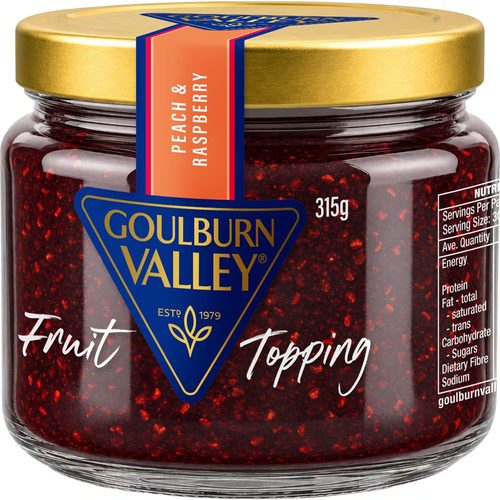
Goulburn Valley Fruit Topping Peach & Raspberry 315g52% fruit
Coles Whole Purple Plums In Syrup leads on
Potassium (higher)
129 vs 0 mg
Energy (lower)
413 vs 457 kJ
Fat, total (lower)
0.2 vs 1.1 g
sugars (lower)
18.5 vs 19.8 g
Side by side, per 100 g
| Value | Coles | Goulburn Valley |
|---|---|---|
| Energy | 457 kJ (109 Cal) | 413 kJ (99 Cal) |
| Protein | 0.3 g | 0.5 g |
| Fat, total | 1.1 g | 0.2 g |
| - saturated | 0.2 g | 0.1 g |
| - trans | - | 0.1 g |
| Carbohydrate | 23.1 g | 24.2 g |
| - sugars | 19.8 g | 18.5 g |
| Dietary fibre | 2.3 g | 2.2 g |
| Sodium | 0 mg | 5 mg |
| Potassium | 129 mg | 0 mg |
✓ marks a difference beyond label-rounding tolerance.
What’s in each can
Coles: see pack
Goulburn Valley: Fruit (52%) [Peach (28%), Raspberry (24%)], Water, Sugar, Thickener (1422), Antioxidant (Asorbic Acid), Natural Flavours
52% fruit