Cals › Biscuits › Compare › Bake Strong Co Choc Caramel Crisp Protein Cookie vs BELMONT BISCUIT CO. Stem Ginger Cookies 200g
Bake Strong Co Choc Caramel Crisp Protein Cookie vs BELMONT BISCUIT CO. Stem Ginger Cookies 200g
Per 100 g, Bake Strong Co Choc Caramel Crisp Protein Cookie has less sodium (280 vs 430), more protein (21 vs 5.7) than BELMONT BISCUIT CO. Stem Ginger Cookies 200g.
Same aisle, measurably different composition. Every number is verified against independent supplier feeds and the labels photographed on pack.
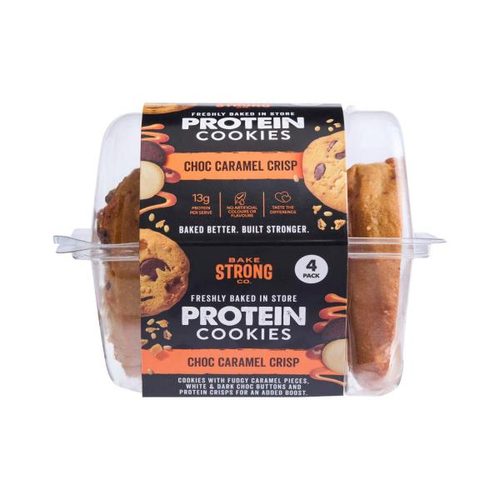
Bake Strong Co Choc Caramel Crisp Protein CookieBake Strong Co
vs
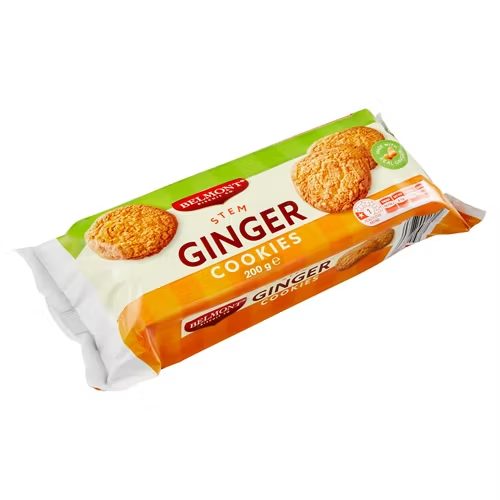
BELMONT BISCUIT CO. Stem Ginger Cookies 200gBELMONT BISCUIT CO.
Protein (higher)
21 vs 5.7 g
Carbohydrate (lower)
43.5 vs 69.3 g
Sodium (lower)
280 vs 430 mg
Fat, total (lower)
15.8 vs 21.1 g
saturated (lower)
8.1 vs 12.8 g
Side by side, per 100 g
| Value | Bake Strong Co | BELMONT BISCUIT CO. |
|---|---|---|
| Energy | 1890 kJ (452 Cal) | 1870 kJ (447 Cal) |
| Protein | 21 g | 5.7 g |
| Fat, total | 21.1 g | 15.8 g |
| - saturated | 12.8 g | 8.1 g |
| Carbohydrate | 43.5 g | 69.3 g |
| - sugars | 32.1 g | 31.8 g |
| Dietary fibre | 1.6 g | - |
| Sodium | 280 mg | 430 mg |
✓ marks a difference beyond label-rounding tolerance.
What’s in each packet
Bake Strong Co: see pack
BELMONT BISCUIT CO.: see pack