Cals › Baking › Compare › CSR All Natural Buttercream Icing Mix Vanilla 250g vs Queen Roses Icing Decorations 16 pack
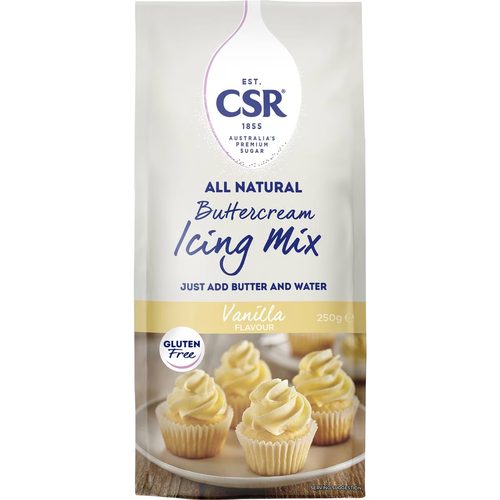
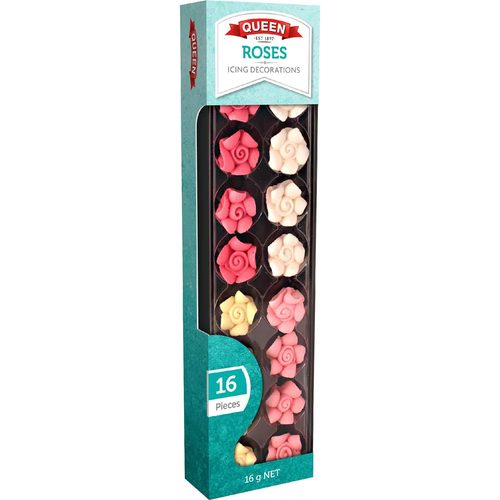
CSR All Natural Buttercream Icing Mix Vanilla 250g vs Queen Roses Icing Decorations 16 pack
Per 100 g, CSR All Natural Buttercream Icing Mix Vanilla 250g has less sugar (96 vs 97.1), less sodium (1 vs 47) than Queen Roses Icing Decorations 16 pack.
Same aisle, measurably different composition. Every number is verified against independent supplier feeds and the labels photographed on pack.
Sodium (lower)
1 vs 47 mg
Protein (higher)
1.4 vs 0.2 g
Side by side, per 100 g
| Value | CSR | Queen |
|---|---|---|
| Energy | 1700 kJ (406 Cal) | 1678 kJ (401 Cal) |
| Protein | 0.2 g | 1.4 g |
| Fat, total | 0.2 g | 0 g |
| - saturated | 0.1 g | 0 g |
| Carbohydrate | 100 g | 97.3 g |
| - sugars | 96 g | 97.1 g |
| Sodium | 1 mg | 47 mg |
✓ marks a difference beyond label-rounding tolerance.
What’s in each pack
CSR: Cane Sugar, Tapioca or Maize Starch, Sweet Corn Powder (1%), Natural Flavour.
Queen: sugar, egg white powder, water, stabiliser (potassium tartrates), thickener (acacia gum), colours (120, 163), plant extract (carthamus), natural flavouring