Cals › Baking › Compare › Betty Crocker Cinnamon Crumble Muffin Mix Muffin Mix 500g vs Queen Vanilla Buttercream Icing
Betty Crocker Cinnamon Crumble Muffin Mix Muffin Mix 500g vs Queen Vanilla Buttercream Icing
Per 100 g, Betty Crocker Cinnamon Crumble Muffin Mix Muffin Mix 500g has less sugar (44.8 vs 65), less saturated fat (5.1 vs 9) than Queen Vanilla Buttercream Icing.
Same aisle, measurably different composition. Every number is verified against independent supplier feeds and the labels photographed on pack.
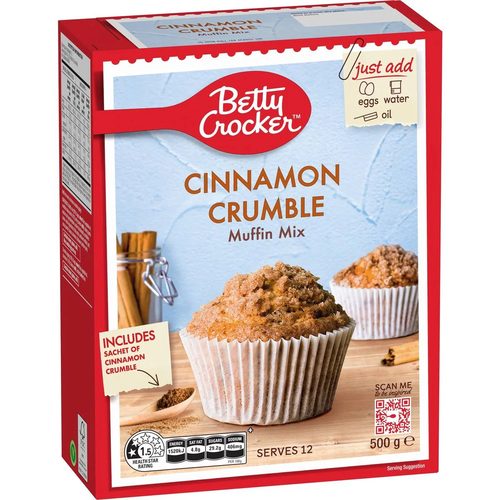
Betty Crocker Cinnamon Crumble Muffin Mix Muffin Mix 500gBetty Crocker
vs
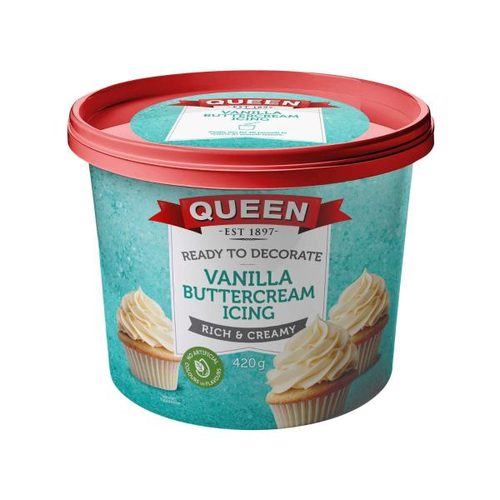
Queen Vanilla Buttercream IcingQueen
Fat, total (lower)
9.4 vs 11 g
saturated (lower)
5.1 vs 9 g
sugars (lower)
44.8 vs 65 g
Queen Vanilla Buttercream Icing leads on
Sodium (lower)
72 vs 595 mg
Side by side, per 100 g
| Value | Betty Crocker | Queen |
|---|---|---|
| Energy | 1670 kJ (399 Cal) | 1670 kJ (399 Cal) |
| Protein | 5.2 g | - |
| Fat, total | 9.4 g | 11 g |
| - saturated | 5.1 g | 9 g |
| - monounsaturated | 0 g | - |
| - polyunsaturated | 0 g | - |
| - trans | 0 g | - |
| Carbohydrate | 72 g | 74 g |
| - sugars | 44.8 g | 65 g |
| Dietary fibre | 1.1 g | - |
| Sodium | 595 mg | 72 mg |
✓ marks a difference beyond label-rounding tolerance.
What’s in each pack
Betty Crocker: Muffin Mix (82%): Sugar, Wheat Flour, Vegetable Oil, Modified Maize Starch (1422), Whey Powder (Milk), Raising Agents (Sodium Acid Pyrophosphate, Sodium Bicarbo
Queen: see pack