Cals › Milk › Compare › East Coast Sustainable Organic Full Cream Milk vs The Complete Dairy Full Cream Milk 1L
East Coast Sustainable Organic Full Cream Milk vs The Complete Dairy Full Cream Milk 1L
Per 100 mL, The Complete Dairy Full Cream Milk 1L has less sugar (3.3 vs 4.9), less sodium (27 vs 50), less saturated fat (2.4 vs 2.5) than East Coast Sustainable Organic Full Cream Milk.
Same aisle, measurably different composition. Every number is verified against independent supplier feeds and the labels photographed on pack.
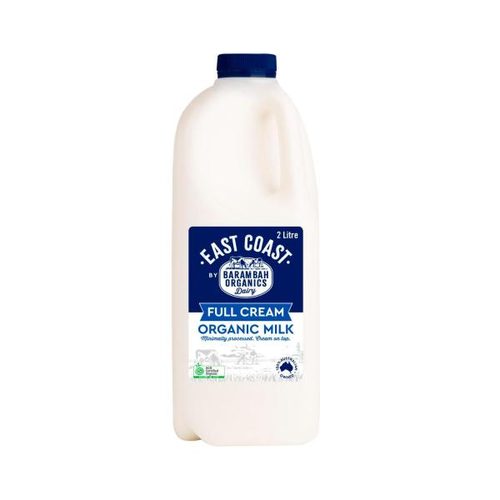
East Coast Sustainable Organic Full Cream MilkEast Coast
vs
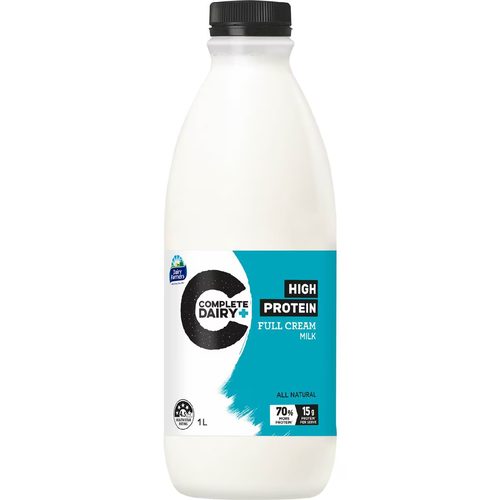
The Complete Dairy Full Cream Milk 1LThe Complete Dairy
no measured leads
Protein (higher)
6 vs 3.4 g
Fat, total (lower)
3.4 vs 3.9 g
Carbohydrate (lower)
3.3 vs 4.9 g
sugars (lower)
3.3 vs 4.9 g
Sodium (lower)
27 vs 50 mg
Side by side, per 100 mL
| Value | East Coast | The Complete Dairy |
|---|---|---|
| Energy | 285 kJ (68 Cal) | 284 kJ (68 Cal) |
| Protein | 3.4 g | 6 g |
| Fat, total | 3.9 g | 3.4 g |
| - saturated | 2.5 g | 2.4 g |
| Carbohydrate | 4.9 g | 3.3 g |
| - sugars | 4.9 g | 3.3 g |
| Dietary fibre | - | 0 g |
| Sodium | 50 mg | 27 mg |
| Potassium | - | 113 mg |
✓ marks a difference beyond label-rounding tolerance.
What’s in each bottle
East Coast: see pack
The Complete Dairy: Filtered Milk.