Cals › Crackers › Compare › OB Finest Speciality Crackers Fig & Pecan 150g vs Peckish Rice Crackers Chicken 90g
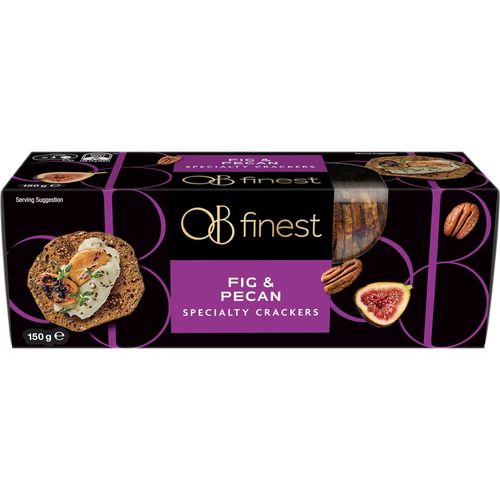
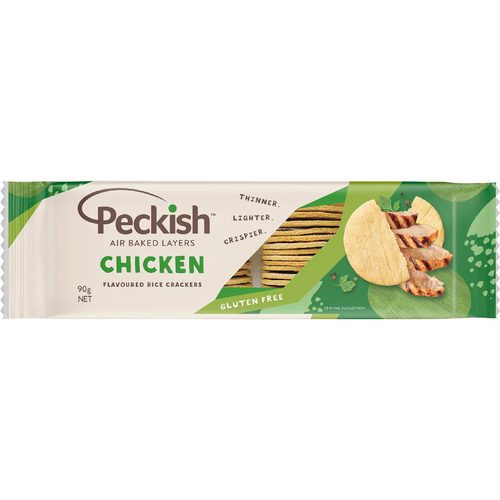
OB Finest Speciality Crackers Fig & Pecan 150g vs Peckish Rice Crackers Chicken 90g
Per 100 g, OB Finest Speciality Crackers Fig & Pecan 150g has less saturated fat (1.4 vs 1.9), more protein (9.3 vs 7.2) than Peckish Rice Crackers Chicken 90g.
Same aisle, measurably different composition. Every number is verified against independent supplier feeds and the labels photographed on pack.
Protein (higher)
9.3 vs 7.2 g
saturated (lower)
1.4 vs 1.9 g
Carbohydrate (lower)
64.8 vs 79.9 g
Peckish Rice Crackers Chicken 90g leads on
Fat, total (lower)
7.6 vs 11.9 g
sugars (lower)
2 vs 27.1 g
Sodium (lower)
452 vs 705 mg
Side by side, per 100 g
| Value | OB Finest | Peckish |
|---|---|---|
| Energy | 1770 kJ (423 Cal) | 1770 kJ (423 Cal) |
| Protein | 9.3 g | 7.2 g |
| Fat, total | 11.9 g | 7.6 g |
| - saturated | 1.4 g | 1.9 g |
| Carbohydrate | 64.8 g | 79.9 g |
| - sugars | 27.1 g | 2 g |
| Sodium | 705 mg | 452 mg |
✓ marks a difference beyond label-rounding tolerance.
What’s in each box
OB Finest: Wheat Flour, Linseeds, Raw Sugar, Diced Figs Dried Figs (10%), Rice Flour, Salt, Honey, Pecans (7%), Greek Style Yoghurt Milk, Cream (Milk), Starter Cultures (M
Peckish: White Rice, Rice Bran Oil (contains Antioxidant (307b)), Sugar, Maltodextrin, Salt, Emulsifier (322 (Soy)), Onion Powder, Flavours (including Chicken Flavour 0.