Cals › Muesli bars › Compare › HILLCREST Bubble Bars Birthday Cake 6 Pack 132g vs Nesquik Cereal Bars Double Choc 120g 6 pack
HILLCREST Bubble Bars Birthday Cake 6 Pack 132g vs Nesquik Cereal Bars Double Choc 120g 6 pack
Per 100 g, Nesquik Cereal Bars Double Choc 120g 6 pack has less sugar (21.5 vs 26.3), less sodium (75 vs 187), more protein (5.2 vs 3.8) than HILLCREST Bubble Bars Birthday Cake 6 Pack 132g.
Same aisle, measurably different composition. Every number is verified against independent supplier feeds and the labels photographed on pack.
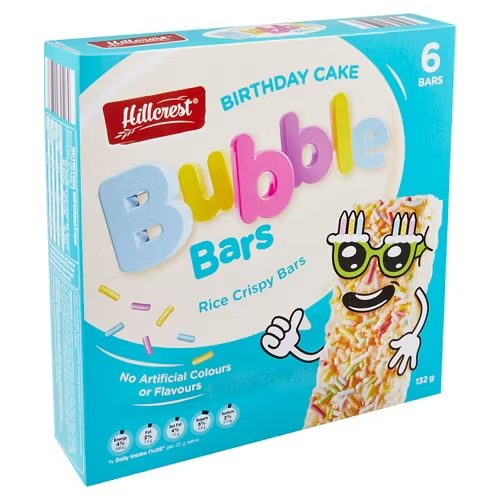
HILLCREST Bubble Bars Birthday Cake 6 Pack 132gHILLCREST
vs
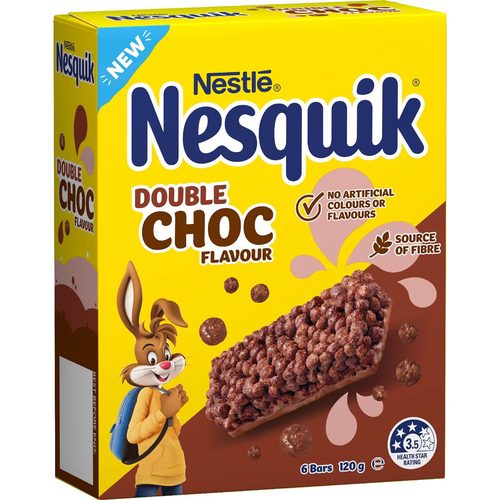
Nesquik Cereal Bars Double Choc 120g 6 packNesquik
Fat, total (lower)
6.2 vs 9.3 g
saturated (lower)
4.4 vs 6.2 g
Protein (higher)
5.2 vs 3.8 g
Carbohydrate (lower)
57.1 vs 75.6 g
sugars (lower)
21.5 vs 26.3 g
Sodium (lower)
75 vs 187 mg
Side by side, per 100 g
| Value | HILLCREST | Nesquik |
|---|---|---|
| Energy | 1580 kJ (378 Cal) | 1570 kJ (375 Cal) |
| Protein | 3.8 g | 5.2 g |
| Fat, total | 6.2 g | 9.3 g |
| - saturated | 4.4 g | 6.2 g |
| Carbohydrate | 75.6 g | 57.1 g |
| - sugars | 26.3 g | 21.5 g |
| Dietary fibre | - | 16.3 g |
| Sodium | 187 mg | 75 mg |
✓ marks a difference beyond label-rounding tolerance.
What’s in each bar
HILLCREST: see pack
Nesquik: Choc Cereal Balls (41%) Whole Wheat (16%), Whole Corn (15%), Sugar, Wheat Flour, Cocoa Powder (1.7%), Salt Glucose, Chicory Root Fibre, Milk Choc Compound (12%)