Cals › Chocolate › Compare › Lindt Excellence Milk Sea Salt Caramel Milk Chocolate Block vs Milkybar Cookies & Cream White Choc Block 170g
Lindt Excellence Milk Sea Salt Caramel Milk Chocolate Block vs Milkybar Cookies & Cream White Choc Block 170g
Per 100 g, Milkybar Cookies & Cream White Choc Block 170g has less sugar (52.6 vs 55), less sodium (105 vs 245), less saturated fat (18.1 vs 20) than Lindt Excellence Milk Sea Salt Caramel Milk Chocolate Block.
Same aisle, measurably different composition. Every number is verified against independent supplier feeds and the labels photographed on pack.
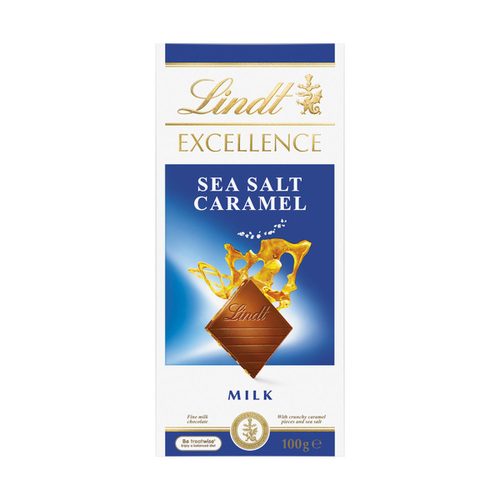
Lindt Excellence Milk Sea Salt Caramel Milk Chocolate BlockLindt
vs
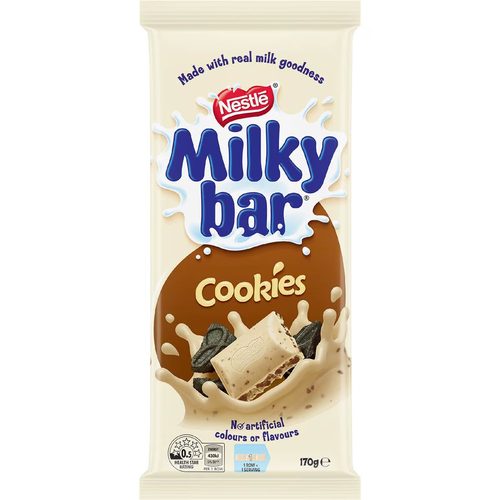
Milkybar Cookies & Cream White Choc Block 170gMilkybar
no measured leads
Protein (higher)
6.5 vs 5.6 g
saturated (lower)
18.1 vs 20 g
Sodium (lower)
105 vs 245 mg
Side by side, per 100 g
| Value | Lindt | Milkybar |
|---|---|---|
| Energy | 2290 kJ (547 Cal) | 2290 kJ (547 Cal) |
| Protein | 5.6 g | 6.5 g |
| Fat, total | 33 g | 32.1 g |
| - saturated | 20 g | 18.1 g |
| Carbohydrate | 56 g | 56.8 g |
| - sugars | 55 g | 52.6 g |
| Sodium | 245 mg | 105 mg |
✓ marks a difference beyond label-rounding tolerance.
What’s in each block
Lindt: see pack
Milkybar: Ingredients Sugar, Vegetable Fat Emulsifier ( Soy Lecithin), Full Cream Milk Powder (23%), Cookies (11%) Wheat Flour, Sugar, Vegetable Oil, Cocoa, Glucose Syrup