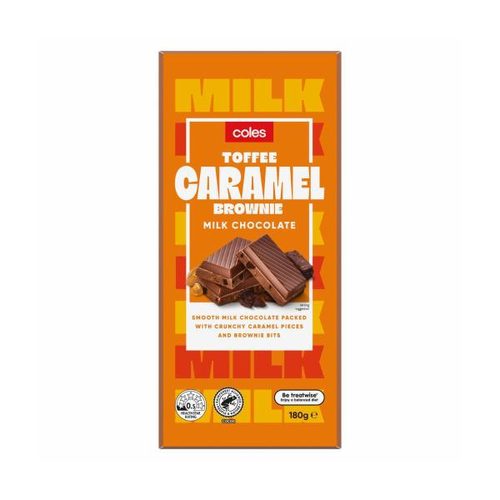
Coles Milk Chocolate Toffee Caramel Brownie Block vs Nestle Crunch
Per 100 g, Nestle Crunch has less sodium (64 vs 236), less saturated fat (16.1 vs 16.7), more protein (7.2 vs 5.93) than Coles Milk Chocolate Toffee Caramel Brownie Block.
Same aisle, measurably different composition. Every number is verified against independent supplier feeds and the labels photographed on pack.

sugars (lower)
50.3 vs 53 g
Side by side, per 100 g
| Value | Coles | Nestle |
|---|---|---|
| Energy | 2180 kJ (521 Cal) | 2180 kJ (521 Cal) |
| Protein | 5.93 g | 7.2 g |
| Fat, total | 27.3 g | 28 g |
| - saturated | 16.7 g | 16.1 g |
| - trans | 0.1 g | - |
| Carbohydrate | 62.3 g | 59.6 g |
| - sugars | 50.3 g | 53 g |
| Dietary fibre | 0.8 g | - |
| Sodium | 236 mg | 64 mg |
✓ marks a difference beyond label-rounding tolerance.
What’s in each block
Coles: see pack
Nestle: see pack